


How to Improve Engagement Rates in GA4
Published: March 03, 2023
Share on LinkedIn Share on Twitter Share on Facebook Click to print Click to copy url

The market is getting more competitive, the landscape is oversaturated with similar companies, and you’re starting to feel the pressure — what can you do to ensure you stand above the crowd? The answer is multifaceted, but one clear way to improve your success rate and user satisfaction is to increase your site’s overall engagement rate.
Related Content:
- Website Analytics Agency
- Google Analytics 4 Agency
- Technical SEO Agency
- Conversion Rate Optimization Services
Attaching engagement rate to elevating your site above the crowd might seem like a stretch at first. However, addressing the issues that can typically result in low engagement rates can improve much more than just the percentage, as it’s akin to using a broad brush to not only paint a large picture, but provide the details from corner to corner.
But before we dive deeper, what exactly is engagement rate?
What is Engagement Rate?
Engagement rate is the amount of sessions that Google Analytics 4 defines as “engaged sessions.” This can be thought of as the inverse of bounce rate, which is now defined as the percentage of users that left a website without visiting another page or left before 10 seconds had passed.
However, GA4 will no longer prioritize tracking bounce rate percentages, and instead rely on the engagement rate metric. There are a few qualifications that have to be met for a user’s session to be classified as an engaged session. At least one of the items below has to fulfilled:
- The user session is longer than 10 seconds
- The user visits more than one webpage
- The session contains a conversion
If any of these criteria are met, GA4 will then add the data to the overall engagement rate percentage.
To put it into perspective, say a user is searching for a belt specifically for dress pants, but they land on a page selling WWE belts. The person will most likely quickly exit the site once realizing their intent was not met.
Another scenario might be a user looking for a quick recipe on an informational site but, once landing on the blog post, they notice the site takes a few seconds to load. They then exit the page to find another site that will perform better. In both cases, the user left before 10 seconds had passed and before moving on from their original landing page. As a result, neither session was an engaged session.
How do You Measure Engagement Rate?
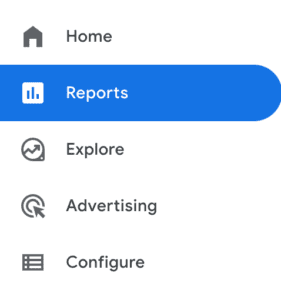
Before fixing low engagement or average engaged times, you first need to identify what your overall rate is and the pages it’s impacting the most. The most effective way to find this information is to use Google Analytics 4. To do this you’ll need to head to the Reports section of GA4 located on the left side of the screen.
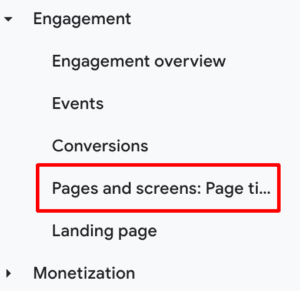
Once clicking on Reports, travel to the drop down menu under Engagement and find the Pages and Screens tab. If your reports are already set up, this tab should display data on views, users, average engagement time and several other options.
If engagement rate is not already included in the listed data, you can add this option through the customize report icon located at the top right of the screen.

Once clicked, a drop down menu will appear with the option to click on a tab called Metrics. The metrics tab will allow you to add engagement rate as one of your tracked items for individual pages.
After completing these steps, you should be able to filter through your site’s pages from the highest engagement rate to the lowest average engagement time.
What is a Good Engagement Rate Percentage?
A good engagement rate percentage can change from site-to-site and the overall data is somewhat sparse. At the moment, the general consensus is that the average engagement rate for all traffic is around 50 percent. Though, organic traffic typically has a higher engagement rate compared to paid traffic — sitting around 60 percent compared to the 55 percent.
But these metrics are relative to the site, whether it be B2B or B2C. Some competitors might have an average engagement rate of 40 percent, but are still able to make their quarterly goals. While others might struggle with this lower percentage. It’s important to track goal completions as well as engagement rates to help form a larger understanding of your site’s potential improvements.
There are a few items to keep in mind when analyzing engagement rates for specific pages. The first is the amount of call-to-actions (CTAs) the specific landing page has. It’s common for pages with a single CTA to have higher exit rates compared to pages that have multiple. Another important factor that may be overlooked is if the site features a cookie banner.
If a user declines to share their data with the page, it may be tracked as a page exit in GA4. This can be a tricky problem to get around, but being aware of it will help clear out some potential issues when analyzing pages or websites with low engagement rates.
6 Tips to Improve Engagement Rates
Now that we know the basics of engagement rates it’s time to figure out how to improve them. From user research to optimizing for relevant keywords, below are 6 vital strategies to improve your user’s engagement.
1. Optimize for Relevant Keywords
The first step to guaranteeing your engagement rate is as high as it can be is to optimize pages for relevant keywords. If your site’s page doesn’t align with the intent of the user, or the query they used to locate your website, then the amount of traffic you’ll receive will be redundant.
To do this, you can use tools such as Ahrefs or Semrush to conduct extensive keyword research for your landing pages. Try to target transactional keywords — such as “for sale” keywords — for your product or category pages. For blog posts or potential posts covering news, aim for information keywords, such as “what is…” or “how to…” to ensure you’re attracting the right audience.
If your site has a lower domain rating, it’s important to focus on long-tail keywords that may feature less keyword difficulty. This will give you a better chance at ranking higher in the SERPs, while still engaging with the right audience.
2. Conduct User Research
The next item to address is acquiring the knowledge of your user base. Understanding what audience your site attracts will put you one step closer to finding out the reason they are leaving. After optimizing your site’s keywords, you can gain some general knowledge of your users by checking the Demographics tab in GA4.

This can display information on user locations, average age, and what devices they are using. If you are a local business, but find that one of your service pages is attracting users from another location, you may need to readjust your local optimization strategy.
One of the more important pieces of information here is the device data listed. Knowing if your main audience is coming from mobile, desktop, or tablet can help narrow down your strategy to ensure you’re focusing on the right version of your site.
If 80 percent of your visitors are coming from IOS devices, then optimizing your site’s mobile CTAs, navigation, and overall structure will be extremely important.
3. Identify User Habits
Identifying user habits is vital when trying to diagnose your engagement rate issues. How is the user interacting with your pages, if at all? What are their navigation habits? What pages are causing the most amount of users to leave?
A great tool to use when identifying user behavior is Hotjar. Hotjar will allow you to set up heat maps or recordings for individual pages. Heatmaps will highlight areas that users frequently click, while recordings will track the habits of the user’s mouse.
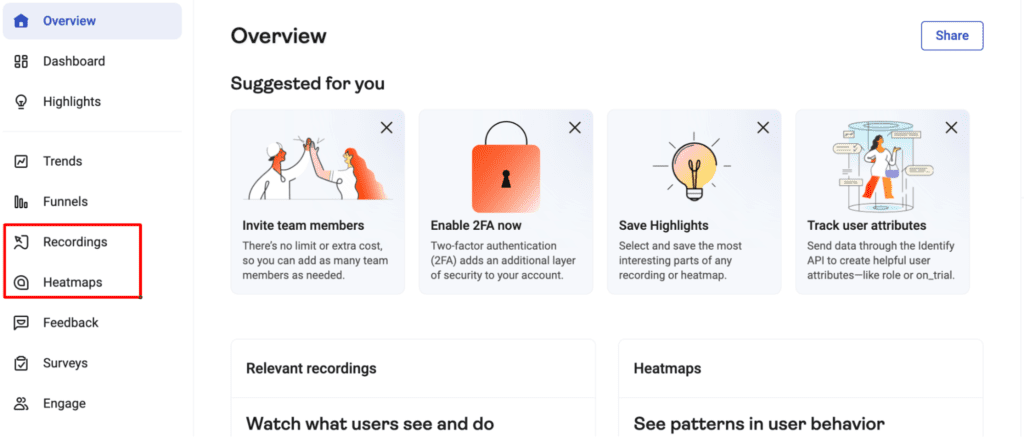
While the recordings are more beneficial for analyzing user engagement length, the heat maps can identify if your CTA’s are getting enough attention or clicks.
Hotjar can also help identify potential internal linking opportunities, as it will display common words users are clicking on. This can be used to funnel users from blog page to blog page, or key conversion pages. Overall, utilizing Hotjar can greatly increase the user experience of your site, which in turn can reduce frustration and exit rates.
4. Review CTA Structure
Another key item to review is the wording and placement of CTA’s on your most prominent landing pages. A good strategy is to ensure your CTA’s prompt an action, preferable with a small amount of text, from the user such as, “Buy Now” or “Schedule a Call.”
Next is to look at the placement of each CTA. Is there one above the fold? Or aligned with the typical eye movement of the user?
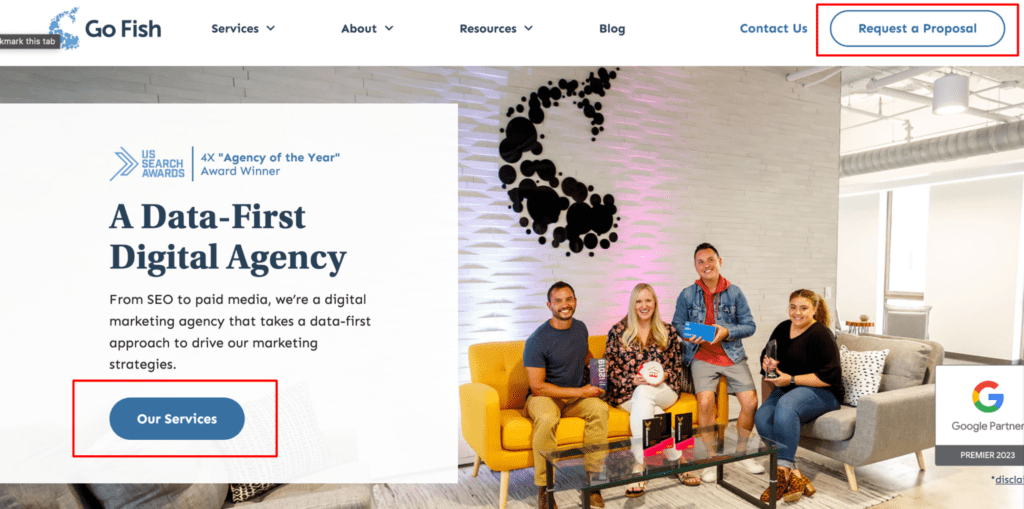
It’s important to remember that users’ eyes most commonly navigate the site in a Z pattern. This means they’ll start at the top left, move to the right, and then repeat. Featuring a CTA in the top right of our navigation, as well as towards the left of your main hero image, are both frequent strategies used when creating CTA buttons.
For example, we can see that our site has the “Request a Proposal” button at the top right and the “Our Services” button on the left side of our hero image.
5. Create Interactive Content
Interactive content is exactly what it sounds like — items that interact with the user when prompted to. Whether it be a button or a moving image, dynamic items can oftentimes grab the user’s attention and create another layer of communication between them and the web page.
When optimizing CTA’s, it can be valuable to add an interactive element through javascript, CSS, or a plugin. Typically, a simple hover element can help boost the interaction between your buttons and users.
However, it’s not always necessary to do this. Depending on your site’s audience and competitive landscape, a static website might perform just as well. When deciding whether to add interactive CTAs, conduct a competitor analysis to get an idea if your target users are visiting similar sites that provide these features.
6. Optimize Site Performance
Following in suite with interactivity, another important step to take is to check the health of your site’s overall performance. You can do this through PageSpeed Insights, which will run diagnostics on your site’s mobile and desktop performance.
The tool will display potential opportunities that will be labeled with the category the issue falls under. For example, it might recommend reducing unused Javascript to help optimize LCP or largest contentful paint. LCP is how quickly the overall content of the web page is loaded, and is one of the three main metrics tracked in the tool.
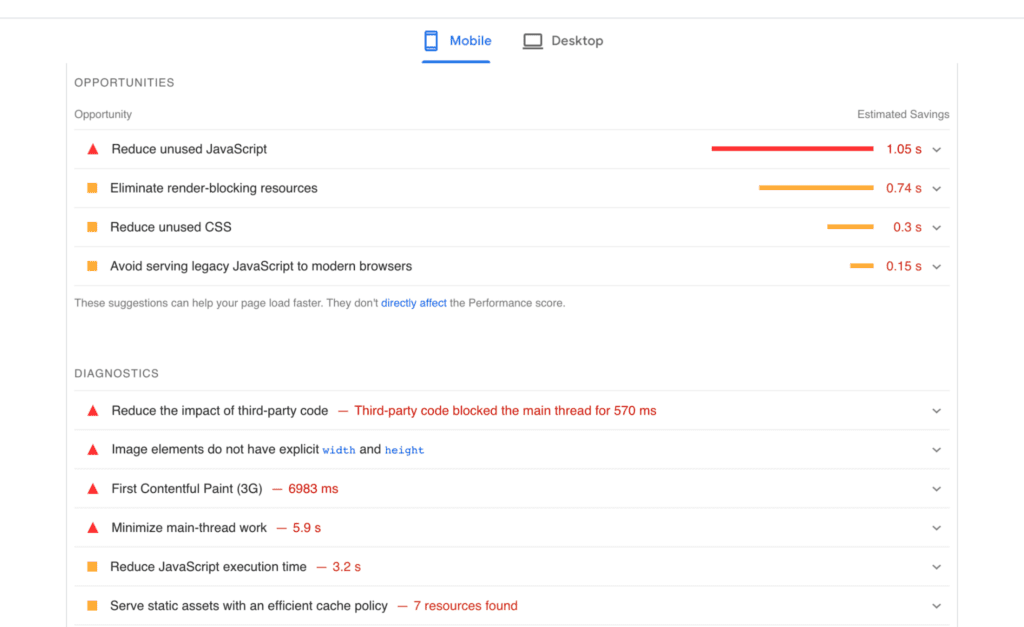
We highly recommend checking your site’s vitals if it uses a ton of javascript to enhance its interactivity. For reference, the common load time web page’s tend to aim for is between .0 and .4 seconds. However, a more realistic goal is to strive for 1-2 seconds.
Overview of Improving Engagement Rate
As we can see, improving engagement rates can oftentimes require analyzing several areas of your website. It can seem like an arduous task, but the steps and end results are well worth it. Having a healthy, optimized website designed specifically for your target audience is essential to reducing exit rates and encouraging more engagement and total conversions.
Now that you have the right tools, you should be on your way to conducting your own engagement research. For more, checkout Go Fish Digital’s blog for the latest SEO information and strategies.