Table of Contents
Getting used to GA4 is going to take time for everyone. With a new dashboard, new metrics, and new dimensions, it can be tough to look past its freshness and focus on some of the additional features GA4 has to offer.
One of these new features is Explorations. Previously a 360-only feature, explorations became a feature for all GA4 users. After undergoing a recent facelift, explorations are cleaner, easier to use, and much more user-friendly.
In today’s blog post, we’re going to be talking about four explorations all SEOs need for their GA4 accounts.
Related Articles:
What are Explorations?
It’s hard to really use one or two words to describe explorations, but here’s how Google describes them:
“Explorations is a collection of advanced techniques that go beyond standard reports to help you uncover deeper insights about your customers’ behavior.”
That’s about as general as you can get, but in short, they are custom-built reports to track, well, anything.
Google has a few standard explorations you can check out, but their goal is to be flexible and custom for you and any stakeholders. Those familiar with Looker Studio may see this as Diet Looker Studio.
One of the biggest advantages here is the ability to export data directly into Google Sheets. Currently, you cannot export data from the GA4 reports into Google Sheets, only into a CSV file.
Accessing Explorations
Before we start creating explorations, let’s talk about how to access them.
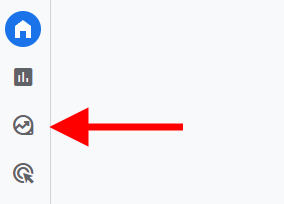
From your primary GA4 dashboard, look to the left where you see the squiggly arrow.
Click on that, and you’ll be greeted with a new menu with different options for explorations.
There are a number of options here:
- Free form: The ‘blank canvas’ of explorations. Most commonly used to create a table.
- Funnel Exploration: Allows users to track funnel progress.
- Path Exploration: Similar to UA’s behavior flow, tracks users’ progress through pages and events.
- Segment Overlap: Compare where custom segments overlap in terms of site behavior.
- Cohort Exploration: Compare users grouped together by similar characteristics.
- User Lifetime: Analyze a user over their specific lifetime.
Each one of these provides unique features and pros. As an SEO and digital marketer, you’re probably just going to be sticking to the first three.
1. Top Pages by Channel
GA4 has this built into the regular reports, but the basic report is clunky and has metrics you probably don’t care about. Creating a top pages exploration allows you to customize your report as you see fit.
To do this, go into Explorations and click on Blank. You can name this Exploration “Top Organic Pages”.
From there, you’ll need to create a Segment to segment out your organic users. Click the ‘+’ sign next to segments then hit Session Segment.
Let’s assume you’re wanting to look at your overall organic performance so start by naming your segment Organic Traffic.
Then, you’ll want to set the conditions for your segment. Click on ‘Add new condition’ and select ‘Session default channel group’. From here, set the condition to ‘exactly matches (=)’ Organic Search. It will look like this:
Hit ‘Apply’ and you’re finished.
From here, we’re going to want to start importing our dimensions and metrics. Dimensions are attributes or characteristics associated with user interactions or events that provide context to the data you collect.
Examples of dimensions are age, country, session medium, session source, first user source, or page title.
Metrics, on the other hand, are the numbers and statistics you’ll see. Those are views, session duration, conversion, revenue, or event count.
Click on the ‘+’ sign with dimensions. When the window pops up, search for the Landing Page. You will see ‘Landing page + query string’ appear. Tick the box then hit import.
Next, we’ll want to import our metrics. This is where you can customize things. Click the ‘+’ sign next to metrics and a similar window will appear. Follow the same step as above, searching and checking all boxes before hitting import.
For this report, I usually like to pull in some basic key metrics such as:
- Sessions
- Session Conversion Rate
- Conversions
- Average Session Duration
- Views per session
You can also bring in additional metrics such as:
- New Users
- Total Users
- Active Users
Explorations can become overwhelming with too many metrics, making the screen look scrunched if you add too many at the same time. Anything beyond about 6 (depending on your screen size) can start to make your exploration look smushed. If you’re making one to export immediately, feel free to add up to 10!
Now, we’ll need to start building it.
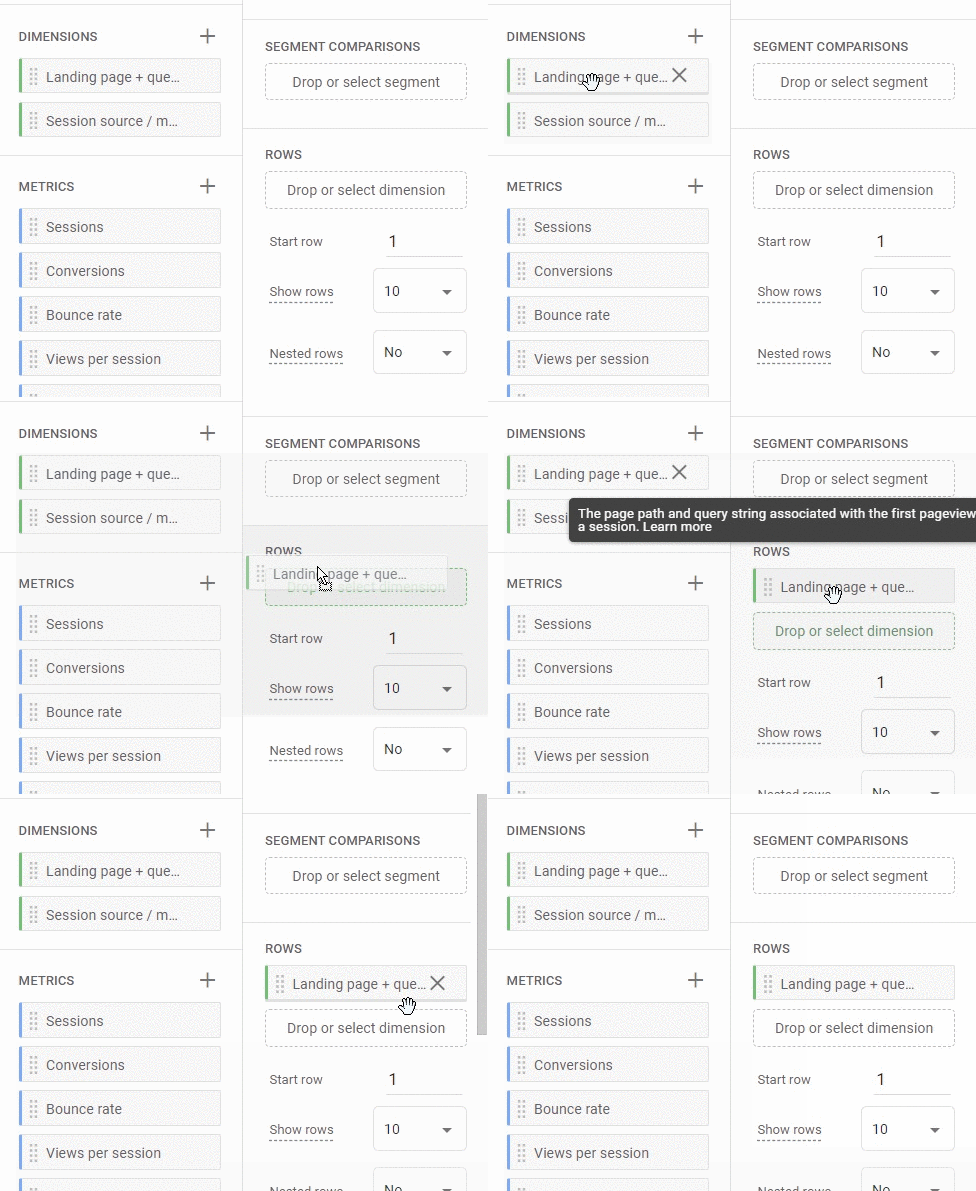
Click and drag the Landing page dimension into rows.
Nothing will appear in the exploration itself, but don’t worry, that’s because we haven’t added any values.
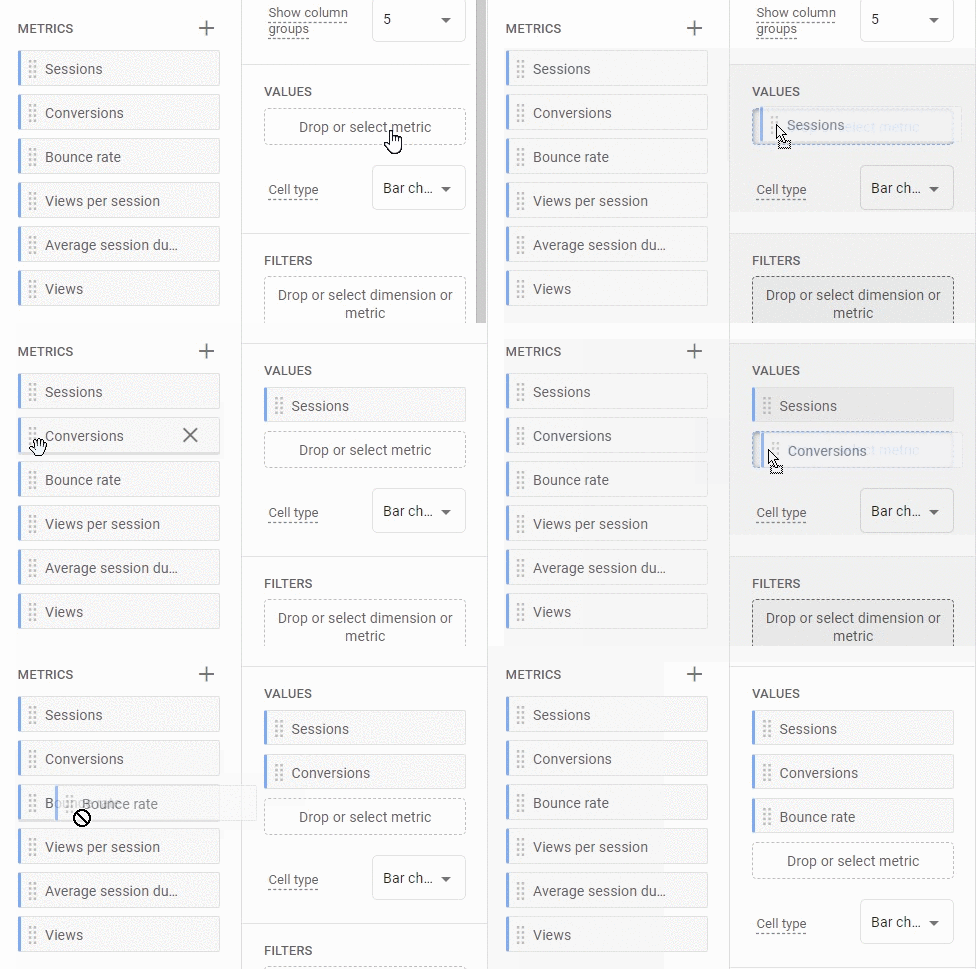
Take your metrics and drop them into the values area.
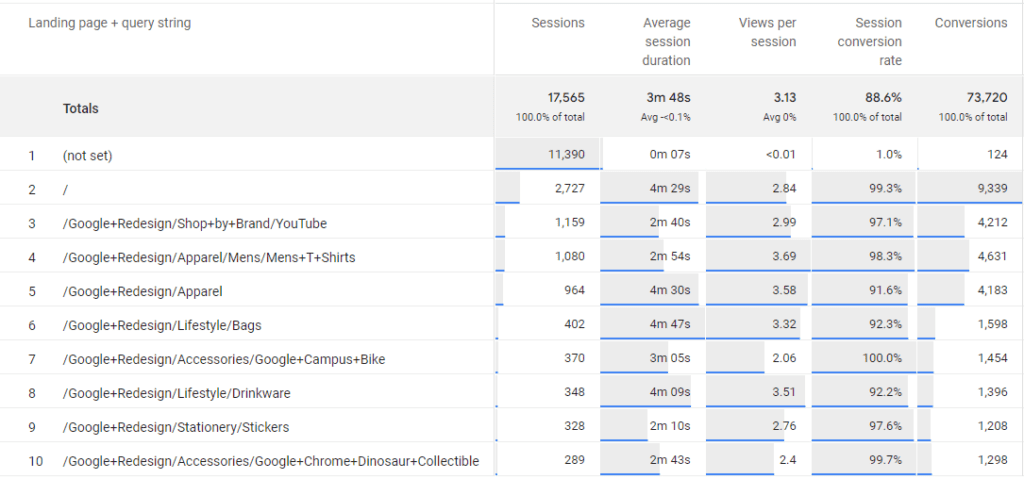
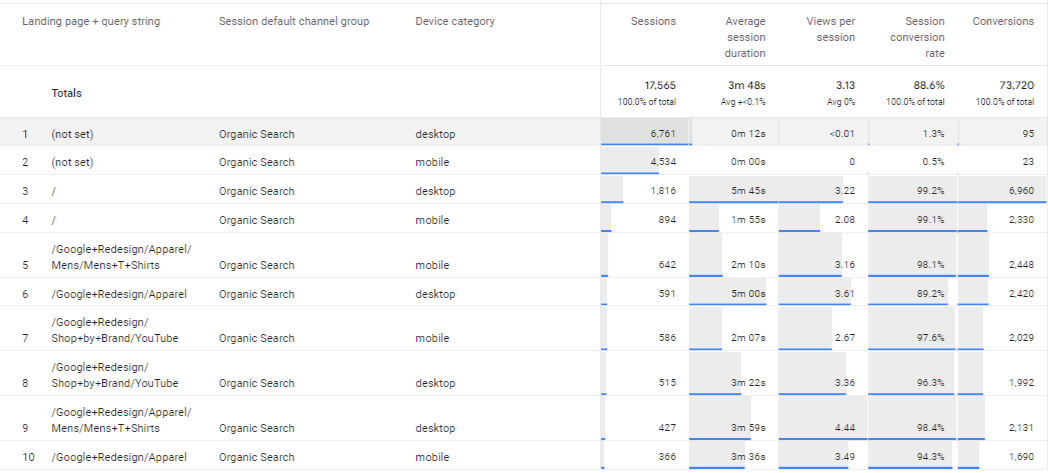
Here, we’ll start to see data fill up your exploration.
Having this exploration makes it easier to see the top pages and the metrics you care about, it’s a must for any SEO.
2. Exploration with 3+ Dimensions
Let’s say you want to examine your top pages by both channel and device. In the standard GA4 reports, you are limited to just two dimensions.
In explorations, you can have multiple dimensions to dive into data a bit further.
Using our above exploration, let’s check out how we would do that.
Go back and click on the ‘+’ sign next to Dimensions. From there, let’s bring in ‘Session default channel group’ and ‘Device Category’. Once again, hit import in the top-right corner to bring in those two dimensions.
What does that look like?
You can even play with filters to remove certain dimension values, such as removing ‘tablet’ from the device category dimension or referral traffic from the session default channel group dimension.
When it comes to adding additional dimensions, you could look to substitute the following,
If you’re wanting a geographical breakdown:
- Country
- City
- Region
Ecommerce activity:
- Item name
- Item ID
- Item brand
- Category
- Date
Demographics:
- Age
- Gender
- Interests
These are just a few of the possible explorations you could make to help give a detailed breakdown of website activity.
3. Path Exploration
For those that used Goal Flow in Universal Analytics, this is similar but provides a lot more flexibility.
For starters, you don’t have to have your ending or starting point set to any particular conversion, it can be any page or event you want (that receives meaningful traffic).
Go back into your explorations dashboard and click on Path Exploration. This will pull up a default exploration created by GA4. It is a solid starting point, but you can easily erase it and start over.
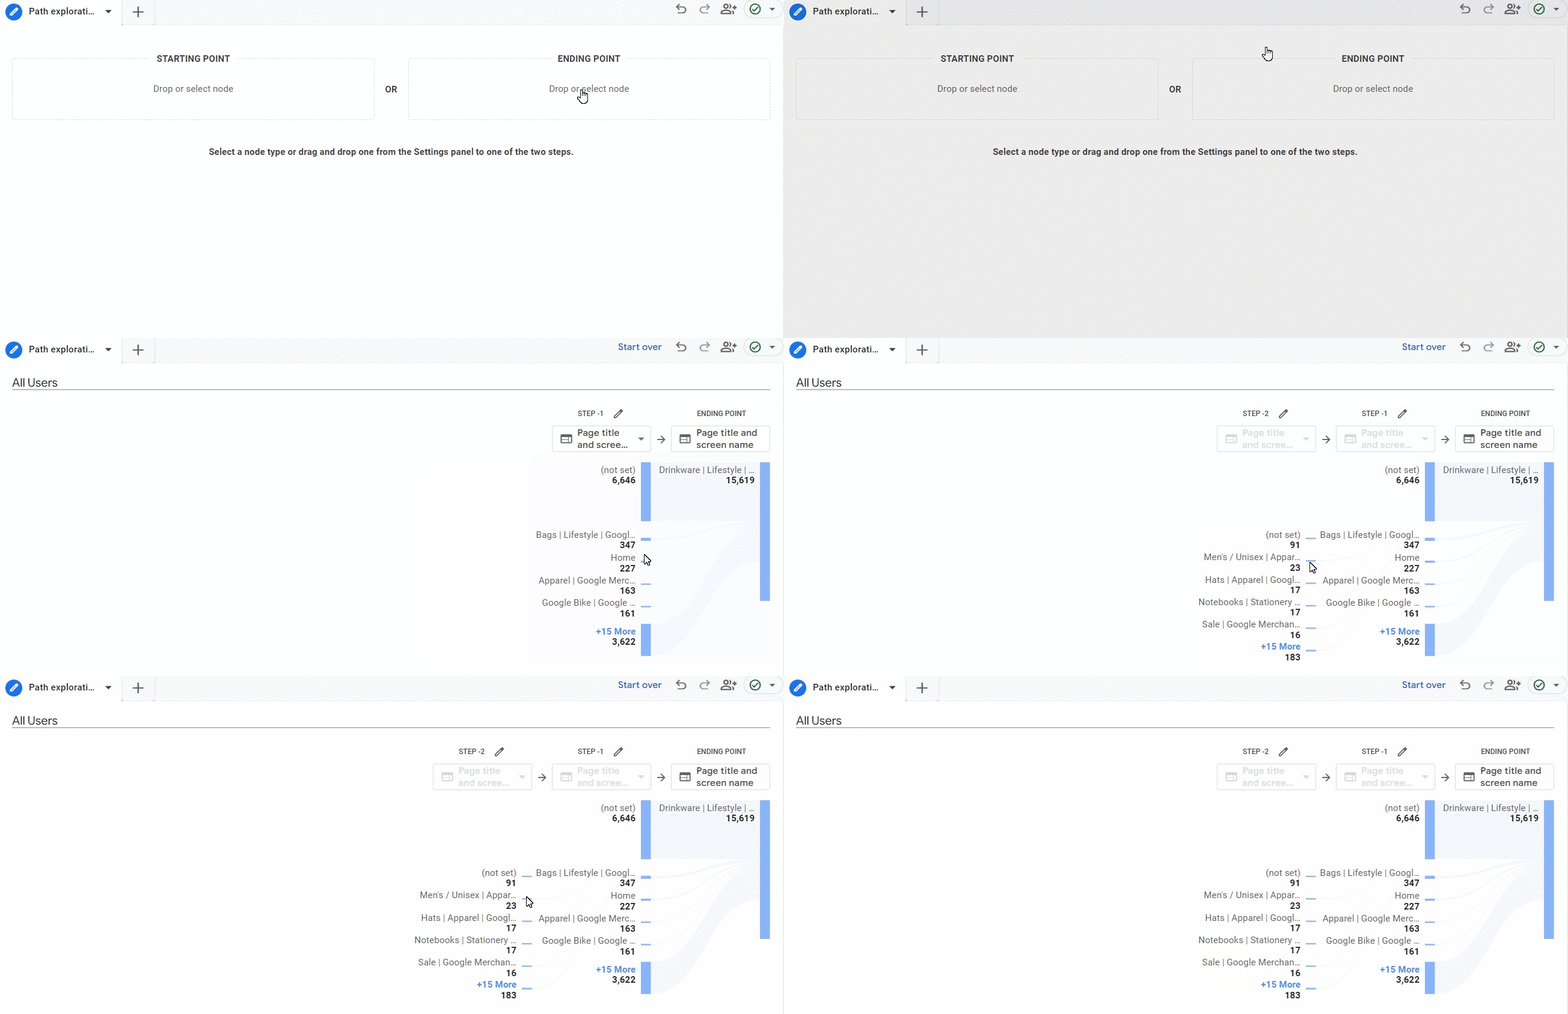
To do that, click on (surprise) the ‘Start over’ button in the top-right corner. You will then be greeted by a screen that asks you to choose your starting or ending point.
For this exercise, let’s choose the Starting Point.
Let’s say you’re interested in seeing user activity after they land on a blog page on your site. Click on Starting Point and then select ‘Page path and screen class’.
When you click on it, you will be shown a number of page paths to choose from. You can either find the one you want to start with or simply search in the top-right corner.
From there, you can click on the blue nodes to see how users navigate throughout your site.
But what if you wanted to have your entire blog or certain category pages in the same path exploration?
To do this, hit Start Over in the top right corner. Choose the event name and then choose session_start.
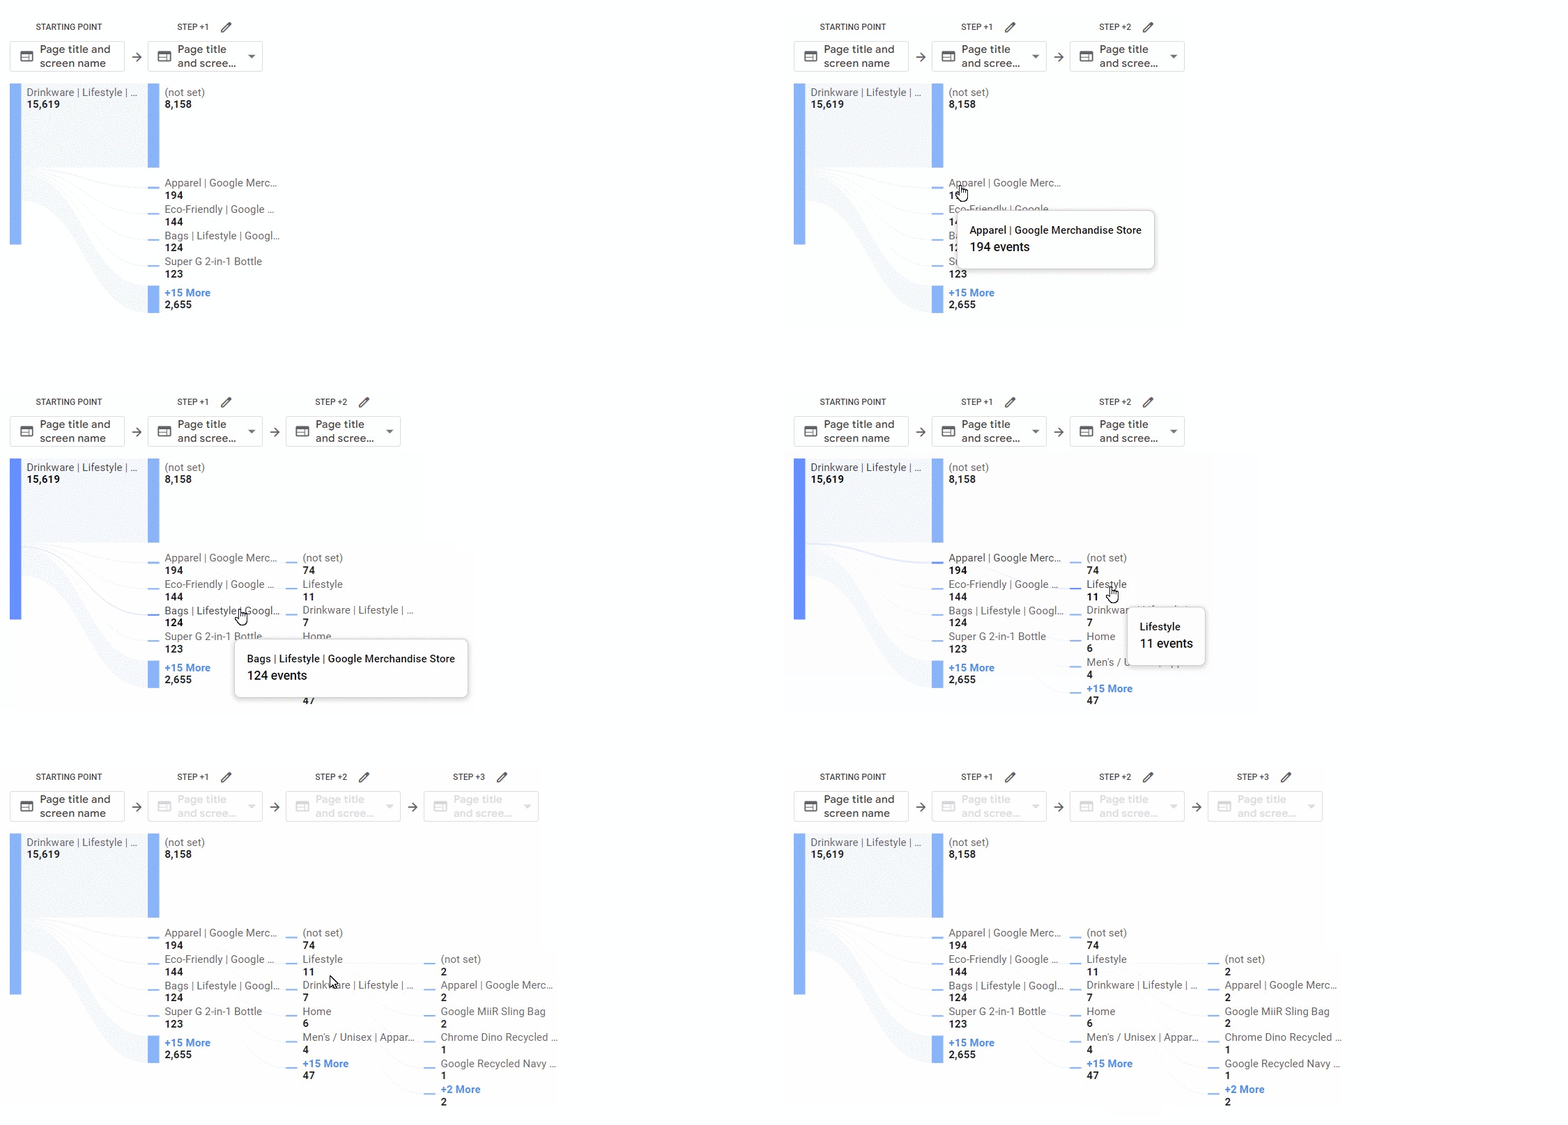
In the second node titled ‘Step +1’, hit the pencil icon. Here, you can select the page paths or page titles you want to be included in the exploration. In this example, I chose the top 3 that have ‘Google+Redesign’.
After doing that, hit apply. You’ll notice that the items you clicked will appear in Step +1.
There is also an ‘X+ More’. DO NOT CLICK ON THAT UNLESS YOU WANT TO RESET YOUR FILTERED SETTINGS. You can see it in the screenshot below where it says ‘+17 More’.
Without clicking on that, you can have your three, four, five, etc. pages set and ready to explore.
Ending Point
What about going the other way and choosing an ending point?
For this, I want to see how people arrived at a certain product page. After selecting end point, I choose the page I want to view.
This is incredibly useful if you’re looking to track specific events or how users arrive at certain pages on your site. Ecommerce site owners may use it to track how users arrived at making a purchase while lead generation site owners might be interested in seeing which content pieces led users to convert.
4. Funnel Explorations
Perhaps one of the most important explorations, funnel explorations can provide a look at how users are behaving across your intended funnel.
To make one, let’s go back to the explorations dashboard and click on funnel exploration.
Once again, GA4 will pull up a default funnel, but it’s helpful in understanding how funnels work.
The standard funnel has the following steps:
- First Visit
- Session Start
- Page View/Screen View
- Purchase
This is tracking the path of first-time users who make a purchase.
As far as funnels go, this is about as vanilla as you can get.
Let’s make an example funnel that shows how users navigate through a Contact Us form.
To do this, click the pencil icon next to Steps. Once inside, you can either delete the standard steps or add steps if you’re starting from scratch.
In this example, I am starting on the Contact Us page and finishing on the Thank You page.
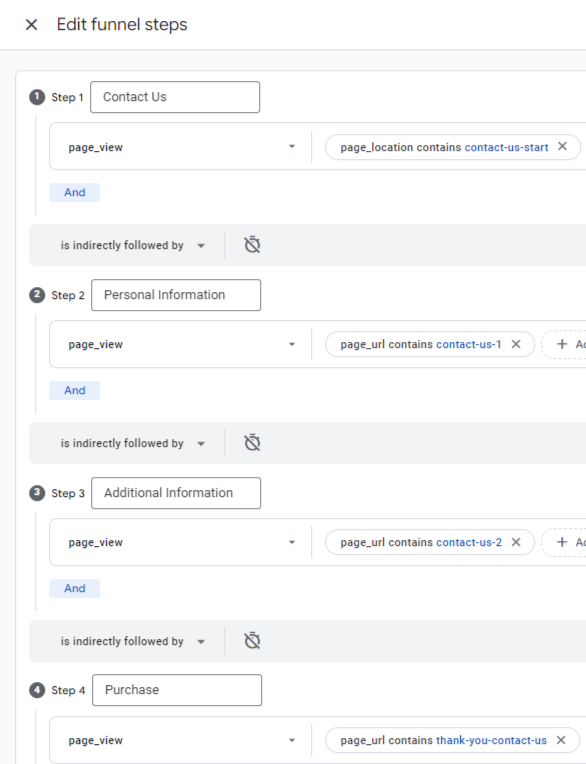
I named my first step Contact Us.
For the parameters, I made the event page_view. Then, I had to tell GA4 which page to start the funnel. I added a condition page_location and said ‘contains contact-us-start’.
There are a number of ways to do this, such as including the full URL or going by page title, but this is to make it simple for this example.
From there, I added the next steps to the funnel to have it look like this:
Once you’re finished, go ahead and hit apply.
Funnel Options
You may have noticed there are some additional options spread throughout the funnel dashboard. Let’s explore those options.
Indirectly/Directly Followed By
This is exactly what it sounds like. You choose to have the steps in your funnel be directly or indirectly followed by the next step. So if you need to have Step 3 of your funnel immediately followed by Step 4, you would select ‘is directly followed by’.
The Timer
Next to that option, you will notice the timer. This allows you to set a time limit between steps. If a user doesn’t complete the next step within the allotted time, then they will not be counted in the funnel statistics.
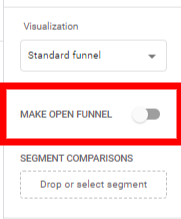
Open/Closed Funnel
You will find this option in the main dashboard of your funnel.
This will give you the option to make your funnel open, as your funnels are closed by default.
An open funnel means a user can enter the funnel at any stage, it is not necessary for them to enter at Step 1 of your funnel.
This can be useful to track some of the most popular touchpoints in your funnel and see where users are entering and leaving throughout the process.
Final Words
Explorations are a great feature for GA4 and one that may be daunting at first glance. With so many options, it’s almost overwhelming to see the number of options available.
But by starting out small with the explorations above that meet your needs, you can start to build out successful reports, gain insights into user behavior, and track overall web activity and performance.
Search News Straight To Your Inbox
*Required
Join thousands of marketers to get the best search news in under 5 minutes. Get resources, tips and more with The Splash newsletter:
