Table of Contents
When you advertise with Google Ads, you’re able to reach customers at the exact moment they search for what you’re offering. But, if you’re not properly optimizing your Google Ads services, it’s much too easy to waste a lot of ad dollars.
In this guide, we’re breaking down exactly how our team of PPC experts approaches Google Ads optimizations. Here’s what we’ll cover:
Analyzing Performance Trends
- Setting up Columns
- Selecting a Date Range
- Tips for Analyzing Google Ads Performance
Optimizing your Google Ads account
- Search Terms
- Conversion Rate Optimization
- Optimizing Text Ad Performance
- Optimizing Quality Score
- Optimizing Audience Targeting
- Optimize Geography Targeting
- Optimizing Bid Strategy
- Optimizing Impression Share
Analyzing Google Ads Performance Data
Before we get into the strategies for optimizing Google Ads campaigns, let’s lay the groundwork for how to analyze performance data in the Google Ads platform.
Configure Your Columns
When you’re analyzing your Google Ads account’s performance data, you’ll want to start by getting the right view of the data. The first step is cleaning up the columns you’re looking at so that you have all the right metrics at your fingertips.
Not sure which columns to add? Start with these as a core list:
- Cost / conv. (cost per conversion = cost/conversions)
- Conv. rate (conversion rate = conversions/clicks * 100)
- Conversions
- Cost
- Clicks
- CTR (click-through rate = clicks/impressions * 100)
- Impr. (impressions)
- Avg. CPC (average cost per click = cost/clicks)
- Search impr. Share (search impression share)
- Search lost IS (rank) (search lost impression share (rank))
- Search lost IS (budget) (search lost impression share (budget))
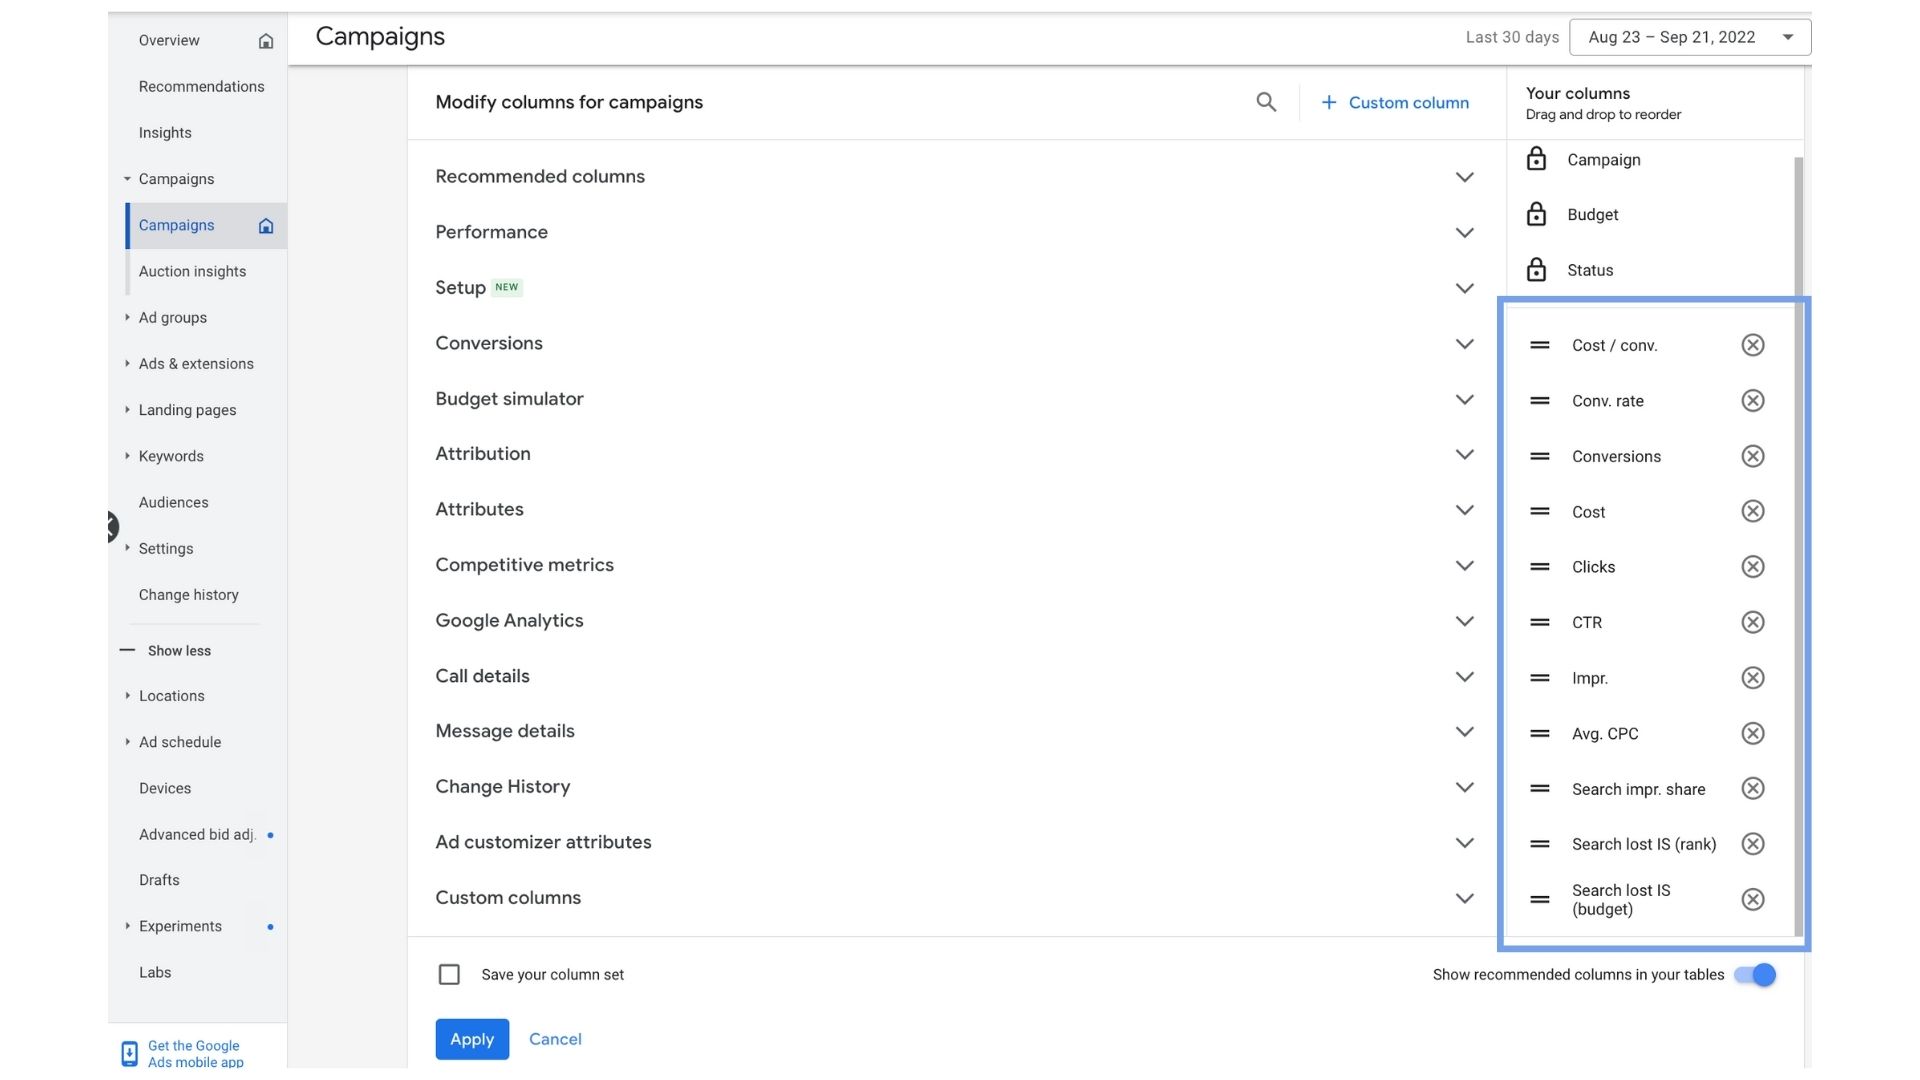
Keep in mind that this is just the tip of the iceberg when it comes to the columns and data you can gather and compare across campaigns in this view. You should absolutely explore other columns and uncover what trends may be available to you outside of just these (Google Ads provides definitions for all of the metrics in the platform if you hover over the column name).
Select a Date Range
The next step in setting up your performance data analysis is selecting the date range(s) to review. There isn’t one best date range to look at, although the last 30 days is a pretty common starting point. However, make sure to do some bigger historical lookbacks as well; think 90 days or more. You should also look at the last 14 days compared to the previous period to understand how any recent changes you’ve made are impacting performance.
By reviewing trends over several time frames, and comparing both period-over-period and year-over-year, you’ll get a holistic understanding of how your campaigns are performing. Google Ads makes it very easy to see comparison trends, and you can even expand out the columns to get more details on how well you’re meeting your advertising goals. You’ll also uncover context for those trends, such as recent changes and seasonality.
Tips for Analyzing Google Ads Performance
Now that your Google Ads platform is configured and ready for your performance analysis, here are some important tips and best practices to keep in mind as you analyze the trends.
Review Results of Past Optimizations
If you are regularly optimizing your Google Ads account, it’s important that you take the time to understand how those past changes impacted performance. By giving those changes a reasonable amount of time to make an impact and then reviewing how metrics changed after, you’ll understand whether those changes had the desired outcome, or whether a pivot in strategy should take place. Should you do more of that type of change in your account, or should you test a different strategy?
To do this, set your date range for the day of that last change to yesterday, then compare to the previous period. By setting this date range, you’ll isolate your review to focus on the impact of the last optimization you made, and be able to easily observe how the metrics changed. (This is why it’s key to not change or test too many things at once; it can be much harder to isolate optimizations and understand their impact.)
Focus on Quality Metrics Over Quantity Metrics
The metrics you’re looking at—and how you’re looking at them—makes a huge difference in the quality of analysis you’re able to pull out.
Think of metrics in two categories:
- First is “quantity” metrics, which is the number of things. These columns would be impressions, clicks, conversion, cost.
- The other category is “quality” metrics. Think: click-through rate, conversion rate, and cost per click.
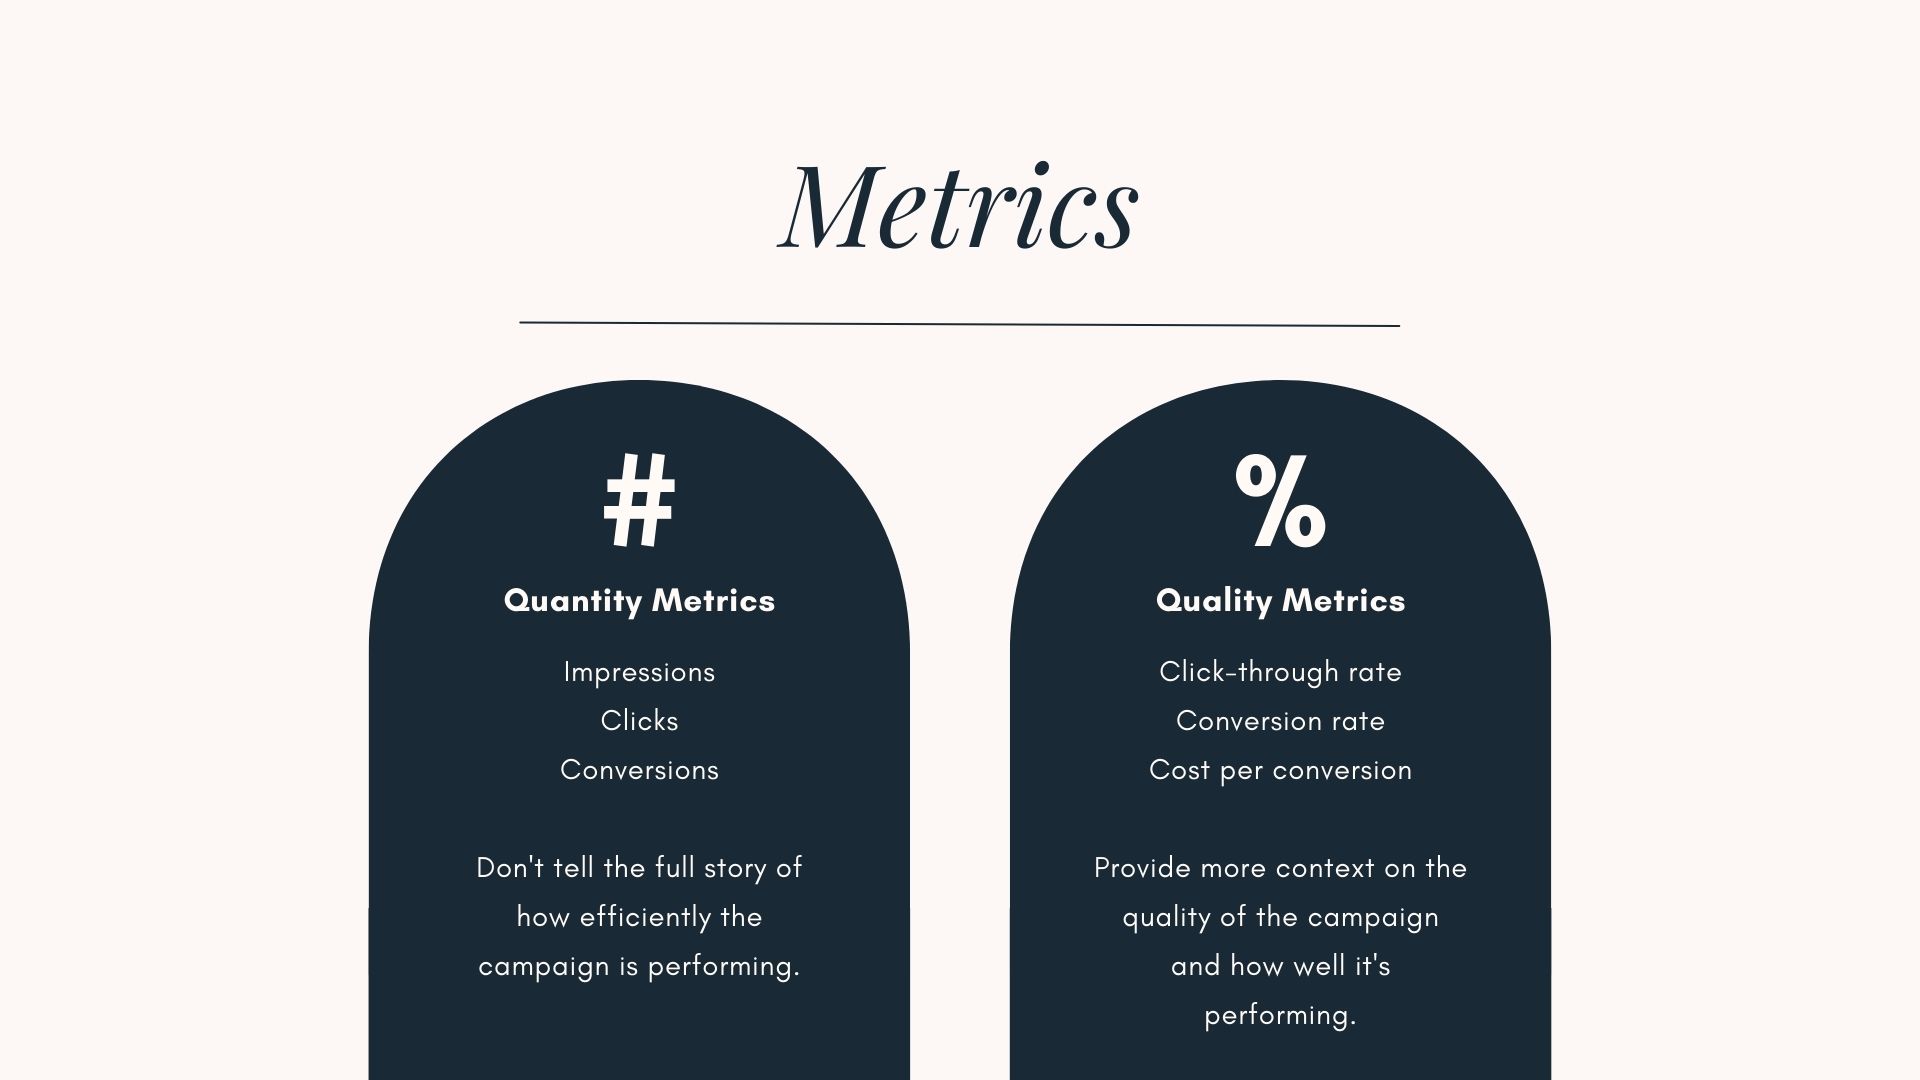
While quantity metrics are definitely useful, they don’t give you the same relative read on performance as quality metrics.
For example, if you increased the monthly budget by $500, maybe you got 100 more clicks as a result. However, you didn’t necessarily do anything differently to get more clicks other than increase your budget. You could get those 100 additional clicks, but also see CTR and conversion rate decrease—meaning they are possibly lower-quality clicks. As a result, you get fewer conversions for your monthly budget.
Your goal with Google Ads is always to get the most out of every dollar spent, and quality metrics allow you to get a better picture of efficiency.
Understand How Metrics Impact One Another
The metrics in Google Ads all impact one another, and by digging a bit deeper you can understand the root of why performance trends are occurring.
Here are some examples:
Increasing Cost Per Click
If cost per click goes up, but conversion rate stays the same, then cost per conversion will also go up. Conversely, if cost per click goes up, but conversion rate also goes up even more, then cost per conversion can still decrease even with a higher CPC.
This would happen if, for example, you paused some lower intent keywords. In doing so, other higher quality, but more competitive keywords get a larger share of the budget. You’ve potentially traded cheaper, lower converting keywords for more expensive, higher quality keywords. Your CPCs may be trending the wrong way, but your bottom line will benefit.
Increasing Click-through Rate
When you optimize your ad copy and your click-through rate increases, users are clicking on your ads more frequently when they see them. This is a good thing! However, an unintended consequence could be seeing impression share decrease. Because you are getting clicks more frequently, you are burning through your daily budget more quickly.
On the flip side, if you optimize your ad copy and improve your quality score, you could see CPCs decrease as a result. This may actually improve your impression share because your budget lasts longer and you’re ranking higher.
Find the Area of Greatest Impact
When optimizing a Google Ads account, it’s tempting to want to go down every rabbit hole and touch every single part of the account. In reality, you can’t—and shouldn’t—do everything all at once. First, that might lead to a pretty lengthy tuning session. But more importantly, if you optimize and change too much at the same time within the same campaigns and ad groups, it will be hard to determine what exactly worked and what didn’t work.
Instead, taking a strategic and gradual approach to optimizations will allow you to see how each change impacts performance. Then you can know to do more of that or test something different.
So, how do you determine what to optimize? You’ll want to find the area where you can have the greatest impact and drill down from there.
Think of the Pareto Principle (aka 80/20 rule). To find the area of greatest impact, you might simply start with the campaign or ad group that gets the most traffic and is allotted most of the budget. Any optimization you make to that campaign or ad group will have an outsized impact on performance.
From there, look at where the greatest opportunity for improvement is. If you can greatly improve conversion rate or click-through rate on a very low performer, that could be more important than gaining a small improvement on an already high performer.
Lastly, consider the types of optimizations you may make and think about which of those could make the greatest impact. Changing ad copy on a single ad would have a very small impact while changing a bid strategy, budget allocation, or a landing page would touch several different campaigns and ad groups.
Use Segmentation to Uncover Opportunities
When you’re reviewing campaign performance, you have the option to segment out performance data in several different ways. Doing this can be eye-opening for seeing which “under the hood” optimizations could be made to improve performance.
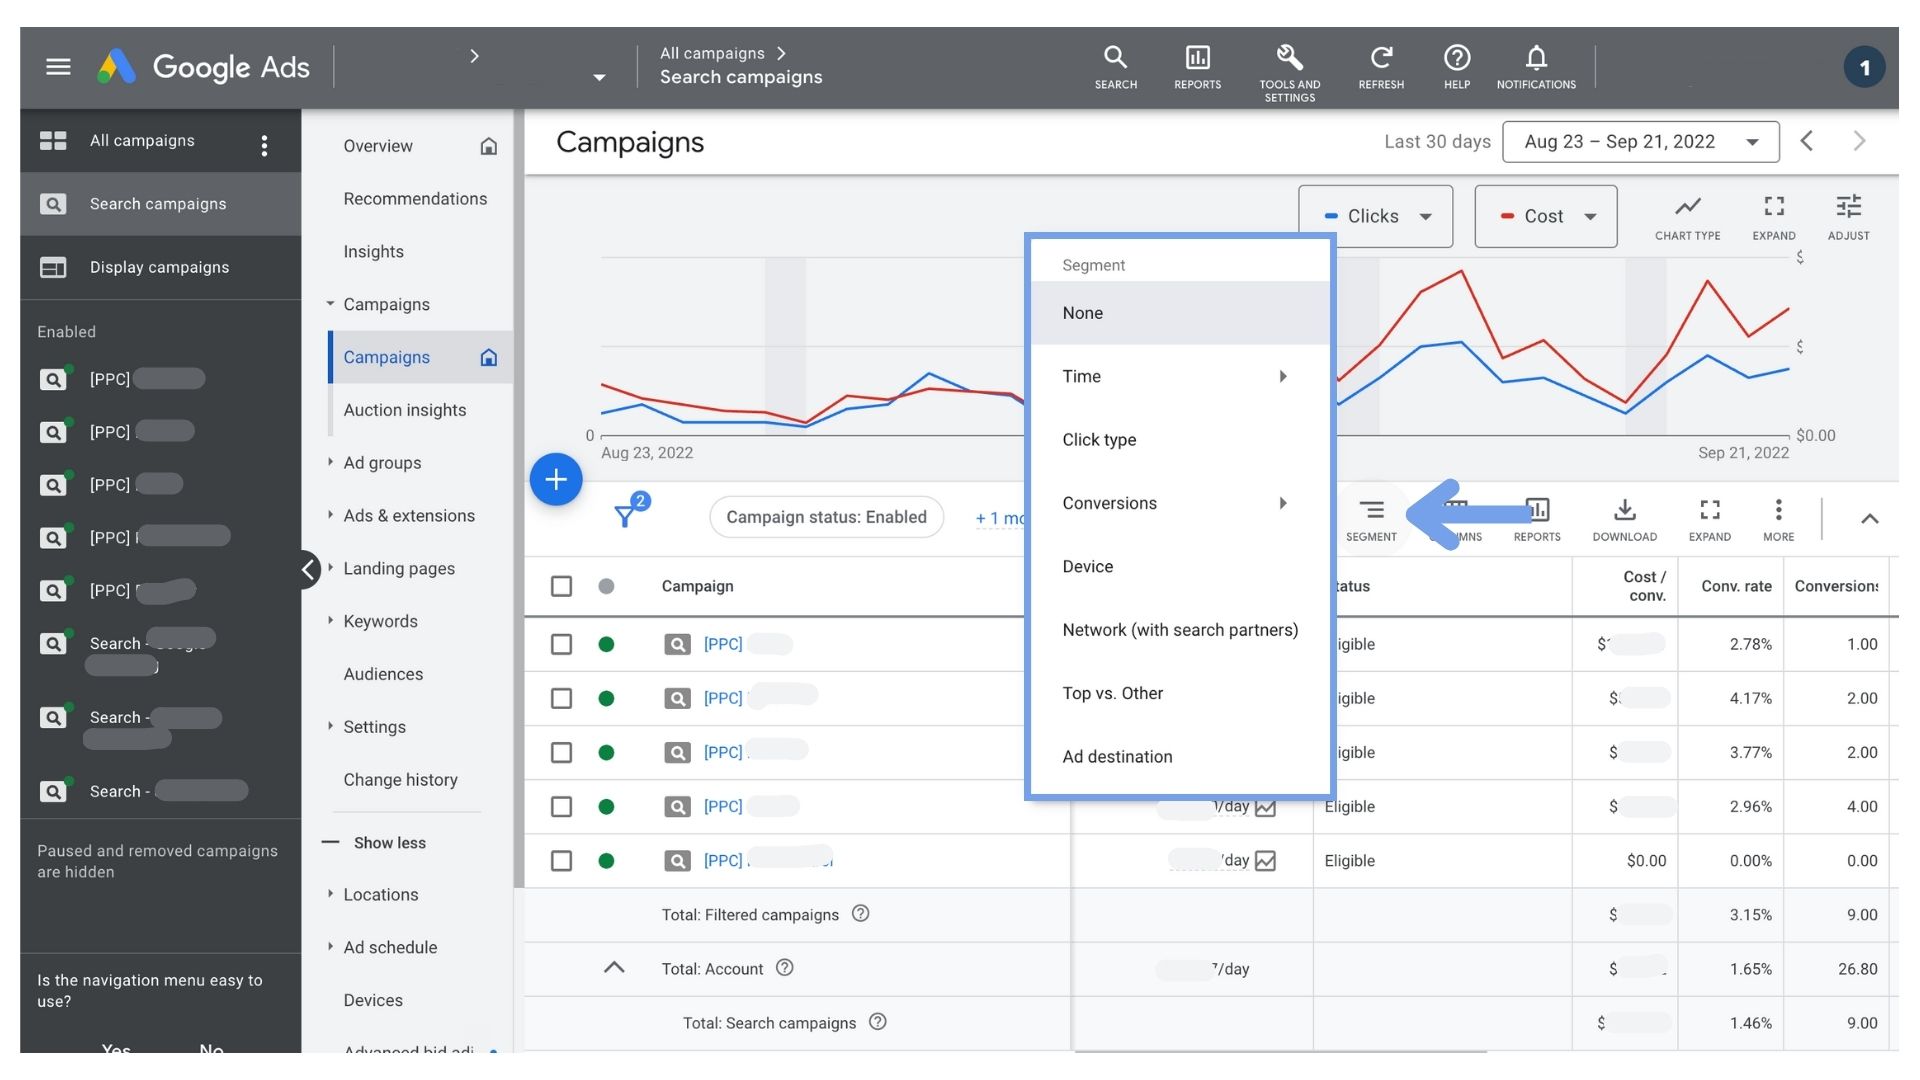
One example of this would be Google Ads network type. Take a look at how Search Partners performs vs Google Search Network—is CTR or conversion rate for Search Partners helping performance or dragging it down? If it’s the latter, then simply turning off Search Partners will allow that budget to be spent on the better-performing Search network and make an immediate improvement in that campaign’s performance.
Another example is devices—if you’re seeing particularly low performance on one device type like mobile, for example, that can lead to actionable learnings and optimizations like improving your mobile page speed and mobile friendliness to improve performance.
Focus on Your Goals
With all of these prior steps in mind, what this process ultimately comes down to is your key objectives for the campaign. Yes, all metrics do impact the others, but ultimately you’ll want to focus on the trends for your most important key performance indicators (KPIs). And, 9 times out of 10, cost per conversion is going to be the holy grail of KPIs because it really gets to the heart of how efficiently you’re getting sales or leads for the money you’re investing.
However, there are certainly times where other KPIs are paramount, such as clicks or impression share. Whatever your objective, start with that most-important KPI and understand how the trends fluctuate, then go from there.
Optimizing your Google Ads account
Now that you’ve reviewed your performance trends and know where to focus your optimizations, it’s time to get down to the business of making your Google Ads account perform better. As mentioned above, you can’t and shouldn’t do all of this in one go. But, these are areas of the account you should be optimizing regularly.
Search Term Review
As Google becomes looser with match types, search term reviews are critical to the health of your Google Ads campaign. Although search term data is limited, you will almost always find something in search terms that’s actionable.
As with any optimization, it’s helpful to narrow down to the biggest area of opportunity. For search term reviews, you could look for a high spending ad group or keyword that has a low conversion rate or click-through rate. Navigate to that ad group or keyword, and look at the search terms specific to that selection. Sort the search terms by highest to lowest impressions (to see the terms your ads show up for most), and by highest to lowest cost (to see where you’re spending your budget most).
Some obviously irrelevant search terms may immediately jump out at you. Others may be less obvious, but the low CTR or conversion rate indicates a problem. For the less obvious problem search terms, plug the search term into a Google search and take a look at the SERP. You may see that the other results have a totally different or mixed intent, and that may give you some indication of why the performance is low.
Once you’ve identified problematic keywords, you have options on what changes to make:
- You could pause the keyword (don’t remove it!)
- You can edit the match type to be more specific
- You can add negative keywords
Conversion Rate Optimization
Conversion rate optimization services should be part of every optimization you make in a Google Ads account. Each change you implement should be leading to a better conversion rate. However, if you’re seeing a downward trend or low conversion rate, here are three things to look at:
Troubleshoot Conversion Tracking
There’s nothing worse than spending time optimizing for conversions, only to realize that the setback was due to a Google Tag Manager configuration issue. To do QA for your conversion set-up, you’ll go to the Tools section in Google Ads, and click to Conversions. From there, check out your conversions and the statuses associated.
What you’re looking for is “tag inactive”—if you see this, then you know something is wrong with your conversion tracking. If you see “no recent conversions”, that’s not necessarily a sign of an issue.
Also, remember that any time you change or add a new form, landing page, or call to action on your website, you need to ensure those conversions are being tracked. If not, you’re missing out on conversion data once you start sending paid traffic there.
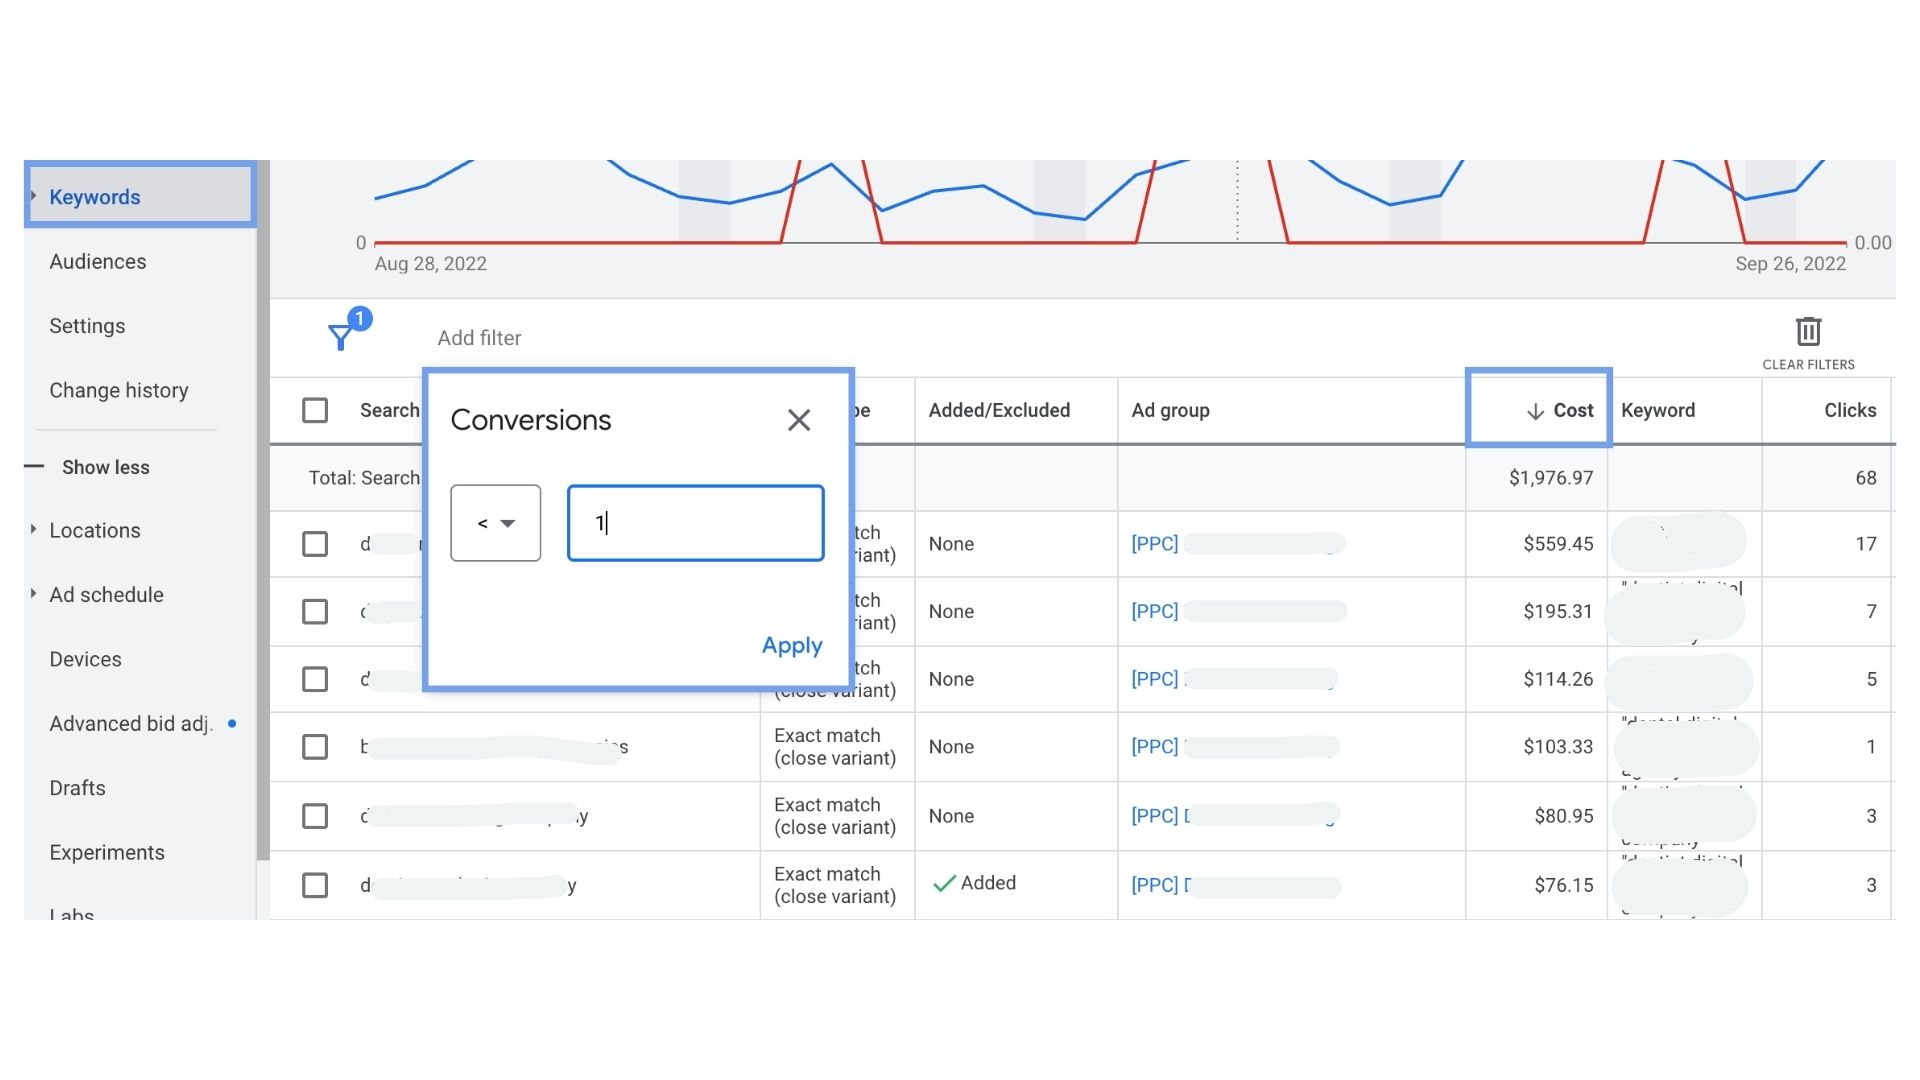
Find Wasted Ad Spend
An easy way to get a sense of how your conversion rate is performing is to look at wasted ad spend. Here’s how to find it:
- Set your date range to anywhere from the last 30-90 days, depending on how many conversions you typically get.
- In a Search campaign, navigate to Keywords.
- Add a filter for conversions < 1. This allows you to see the keywords that haven’t converted during your date range.
- Sort by cost, and you can see what your biggest budget wasters are.
- Go back to the Search Term Review steps and analyze what’s not working for these low-performing keywords.
Analyze Budget Allocation
Another quick but high-impact way to improve conversion rate is to analyze how your budget is allocated compared to conversion rate and cost per conversion metrics. Look at conversion rates and cost/conversion across your Search campaigns and find high-spending, underperforming campaigns.
Are there other campaigns that are performing better where you can allocate more money and increase those good results even more?
On a more granular level, dive deeper into underperforming or high spending campaigns. Within these, are there outlier ad groups where you’re seeing particularly good or bad conversion metrics? If so, you could consider separating the outlier into its own campaign to gain more control over exactly how much you spend on it, rather than having it share a budget with other ad groups.
Optimizing Text Ad Performance
Your ad copy is essential for driving your target audience to your website for two big reasons:
- Click-Through Rate: Compelling ad copy can entice your target audience to click on your ad over your competitor’s ad.
- Quality score: How relevant your ads are to the keywords you’re targeting can greatly impact how much you have to spend on each click.
With the sunsetting of Expanded Text Ads and emergence of Responsive Search Ads (RSAs), Google has taken a lot of the manual work (and also advertiser control) out of optimizing ad copy.
By creating Responsive Search Ads, you provide Google with several headline and description options, and Google’s machine learning makes the decisions about which combinations to serve based on performance. That said, you should still be actively reviewing, testing, and optimizing ad copy.
As always, narrow your focus to ad groups where a higher CTR would make the biggest impact, and start there. Here are two ways to do this:
- Start with the ad group that gets the most impressions. If you could harness that high search volume into more site visits with a higher CTR, there’s a lot of potential for ad copy optimization to have a big impact.
- Look at your top three converting ad groups, then start with the ad group of those that has the lowest CTR. If an ad group has proven to work for you by having a high conversion rate, then do everything you can to drive more traffic to it.
Now that you’ve selected which ads to optimize, here’s a quick guide to improving that ad copy.
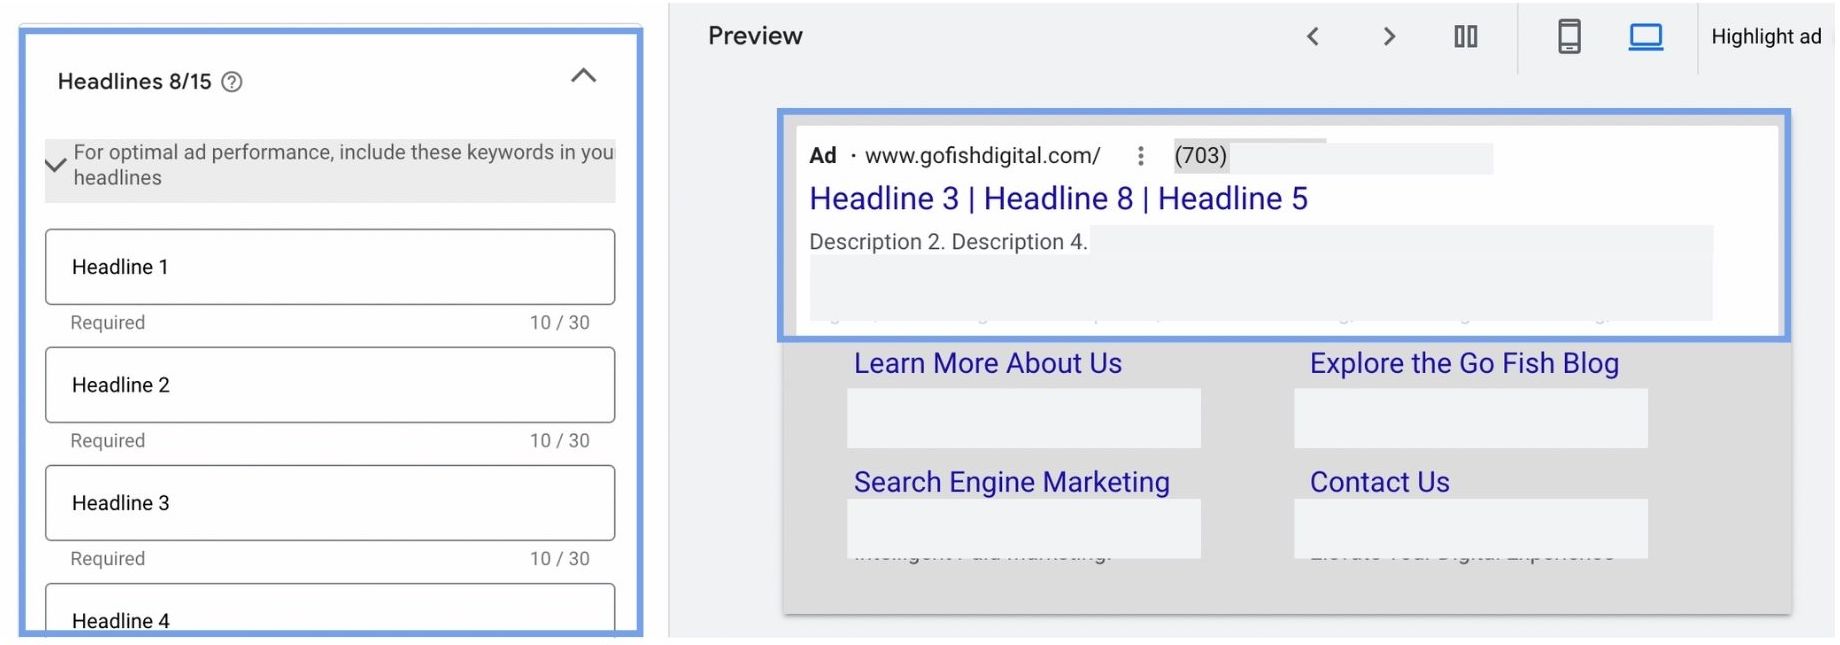
Review Ad Performance
Each headline and description of an RSA is given a Performance rating of Best, Good, Low, or Learning.
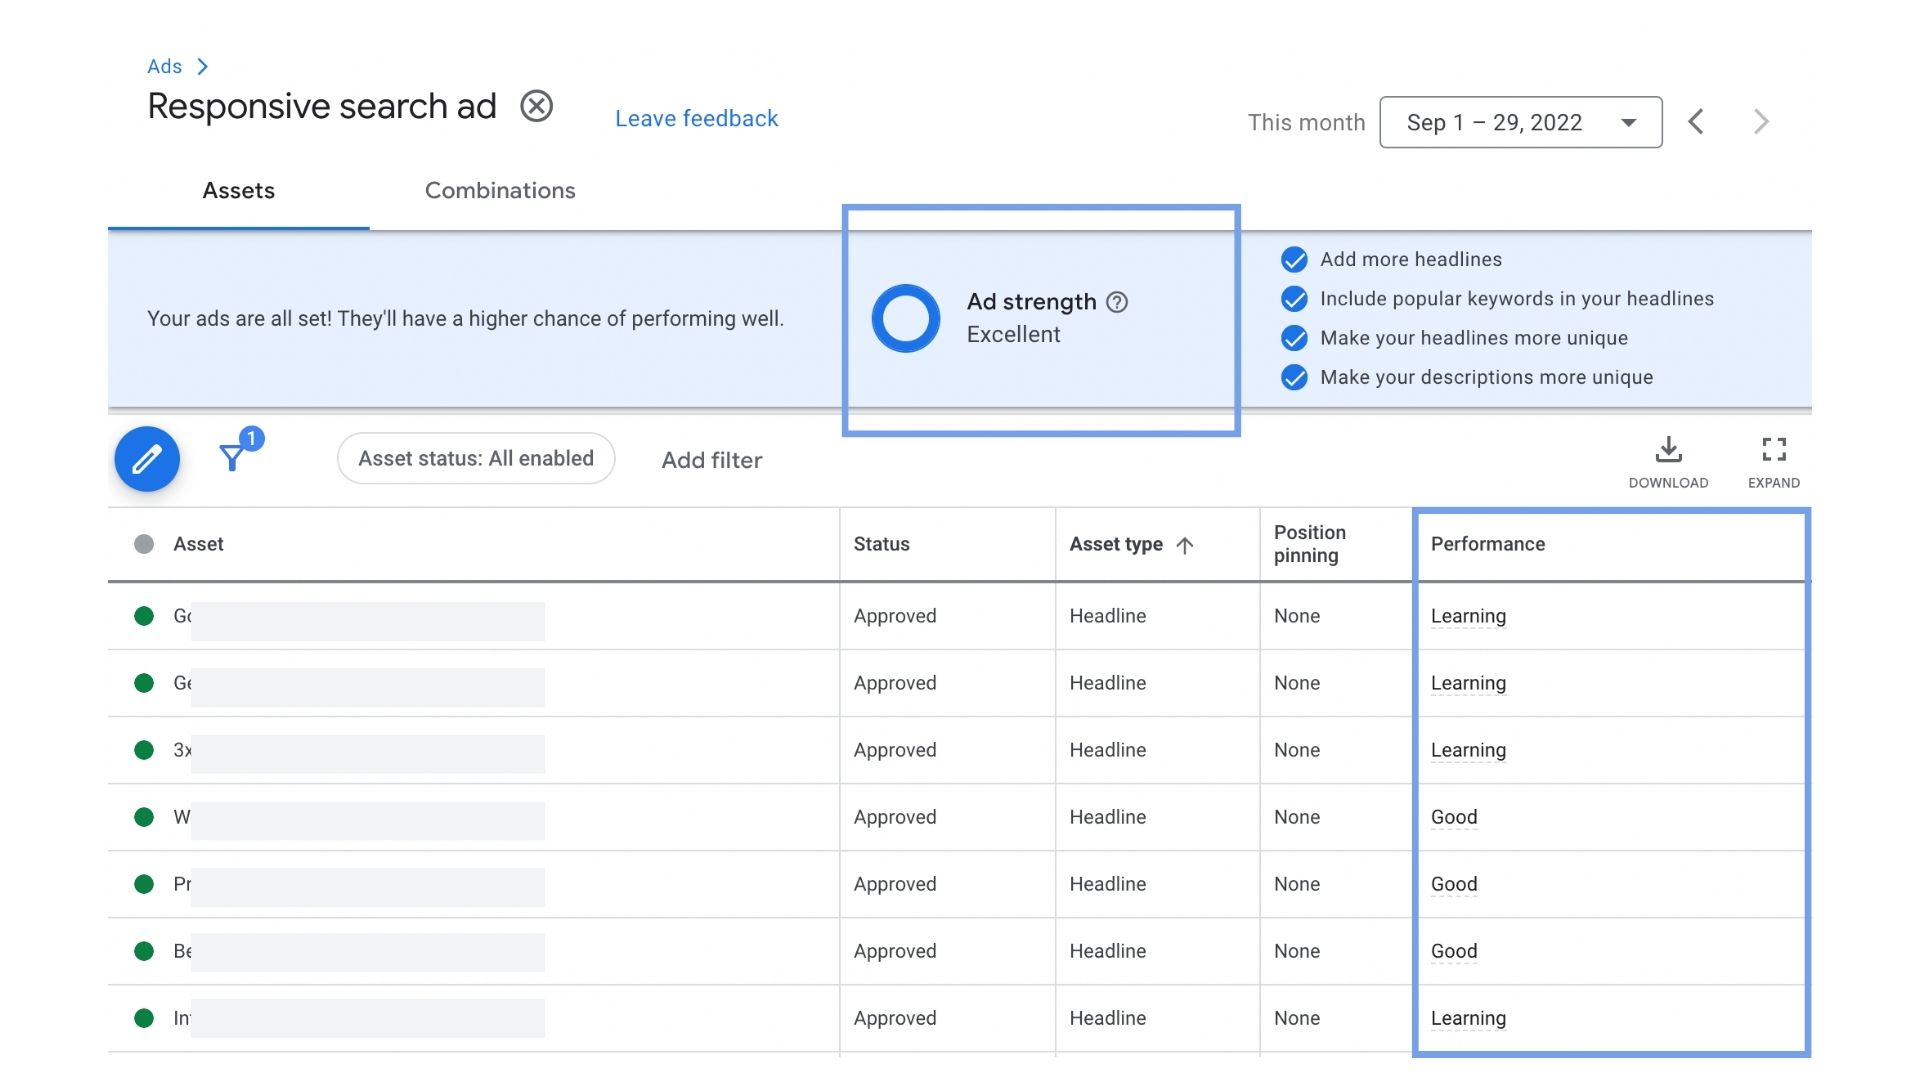
- For the Best ratings, look for common denominators and trends. You can take those learnings to do more of what’s working well in other ad groups.
- For the Low ratings, replace those with new ad copy to test out. Keep notes on the changes you make and look back to see if the rating improved.
If you don’t see this column under Asset Details, your ad doesn’t yet have enough impressions to give a rating. Instead, you can review the overall “Ad Strength” rating. You can also look at the most common ad combinations to find what headlines and descriptions Google is favoring based on performance.
Analyze Competitor Ad Copy
There are many tools out there to help you conduct a competitive analysis, but a great place to start is with a good old fashioned search engine results page (SERP) review. Using the Google Ad Preview tool, search some of your top keywords and search terms and objectively observe the SERP and your competitors’ ads.
What catches your eye, and how could you leverage that for your account? For example, do all of your competitors have star ratings on their ads? Or pricing? These are eye-catching elements that you should be using as well.
Use All Available Ad Assets
Google favors ads with all assets (formerly ad extensions) utilized, so you’ll want to make sure you’ve got any applicable assets configured. Moreover, make sure your assets are strategically optimized for each ad group.
For example, set up your sitelinks at the ad group or campaign level so that they are perfectly customized for the search intent and needs for those specific searchers. Someone searching your brand name should see a different set of sitelinks than someone searching for a top of funnel keyword because there is a different intent and level of familiarity for those two search terms.
Optimizing Quality Score
Quality score can have a big impact on your ad rank and cost per click. The higher your quality score, the less you’ll have to pay for each click, and the difference adds up over time.
There are three components to your quality score, which is calculated at the keyword level:
- Ad relevance: How closely does your ad copy match the intent of the user’s search?
- Landing page experience: How relevant and useful is your landing page to the user once they click on your ad?
- Expected click-through rate: How likely is it that your ad will be clicked when it’s shown?
To find which keywords to optimize, sort your keywords by highest to lowest clicks in the last 30 days (exclude keywords with very few clicks). Starting at the highest clicks, identify high CPC keywords with a quality score below 5. You’ll see a bigger impact by improving the very low quality scores (1-5) than you will by bringing a 7 quality score up to an 8.
Once you’ve identified the keywords that need quality score optimization most, review the individual quality score ratings: Landing Page Experience, Expected CTR, and Ad Relevance. Each of these factors gets its own score, so you can see what the area of focus needs to be.
Landing Page Experience is often the best place to start. If many of your keywords show a “below average” landing page experience, there could potentially be a single optimization, like improving page speed, that could impact all of your keywords at once. Besides page speed and mobile experience, simple page content can have a big impact on quality score. If there is little content on your landing page, then there’s not much of an opportunity to have your keywords also be present on the landing page. Again, by adding more relevant content to the page (which includes your keywords), you’ll be able to impact the quality score of many keywords at once.
For Ad Relevance, make sure that your keywords are present in your ad copy itself. Comb through and make sure that each keyword is actually in at least one headline or description. If you find that there are too many keywords in your ad group to fit all of them into your ad copy, you may consider whether your keywords should be grouped into more than one ad group.
In addition, keep in mind that having the ad copy and landing page copy sync up is also a factor in quality score. Make sure that you’re using similar language in both the ad copy and on the landing page, and of course that each contains your keywords, so that there is complete synergy between the three.
Optimizing Audience Targeting
Google Ads is relying more and more on audience signals for its machine learning. To give Google a headstart with this, and to give yourself additional data points, you can, and should, add audiences to your search campaigns.
There are two options for adding audiences:
- Targeting, meaning you only want to target people who are in this audience and also searching for your target keywords. This set-up isn’t recommended unless you have a very specific reason, like search remarketing. Applying the targeting option will really limit your reach with search, which usually isn’t necessary since you’re targeting a certain search intent already.
- Observation, meaning you simply want Google to report on how this audience’s performance metrics compare with other audiences and the average. Before Smart Bidding, advertisers would apply bid adjustments to these observation audiences to manually control bids at the audience level. Nowadays, you simply add audiences that you want Google to observe and mostly let Google do the bid adjustments. The goal with this is to simply point out audiences that you want Google to observe, and then allow Google’s machine learning to adjust bids faster and smarter than you could.
Review your audience performance data.
Even though Google is actually doing the heavy lifting on optimizing bids by audience, it is definitely worth reviewing audience performance regularly. To do this, it’s actually helpful to start with audience data from Google Analytics, rather than only looking at audience performance in Google Ads. You can view the Analytics audience data both for your paid campaign specifically, and for your site as a whole. Here are some ways to use that Google Analytics data:
- Review the audiences that Google Analytics shows your ads to be bringing to the site to gain more clarity into the search intent of those users. For example, if you see a very high number of Job Seekers in your audience, but you’re not intending to use your ads for recruitment, this may be an indication that the search intent of people clicking on your ads is misaligned with your goals. By reviewing search terms, adding negative keywords, and potentially even excluding that audience, you can use that nuanced information to filter out the wrong audience.
- Google Analytics audience data is also helpful for identifying audience characteristics that may be unexpected. When it comes to audiences, and really anything in digital marketing, we always advise leaving our assumptions at the door and letting the data lead the way. For example, you may assume that your best audience is coupon clippers but may find instead in your Google Analytics data that luxury shoppers make up a large portion of your audience and also convert well. Having this information may help inform other audiences that you want Google to observe in your campaigns, as well as things like ad creative tests.
Optimize Geography Targeting
Similar to audiences, geography is another targeting element that digital marketers used to spend a lot of time optimizing. However, with Smart Bidding, adjusting bids based on geography has now become an area that Google does a lot of the heavy lifting in. But, just like with audiences, geography performance is worth a regular review to uncover surprising trends.
To review geography performance, you’ll navigate to the campaign (geography is set at the campaign level), and click on Locations. From there, you can narrow down to country, state, city, etc. and you can review performance for both your Targeted locations (the location you targeted) and your Matched locations (the physical location or location of interest of the user).
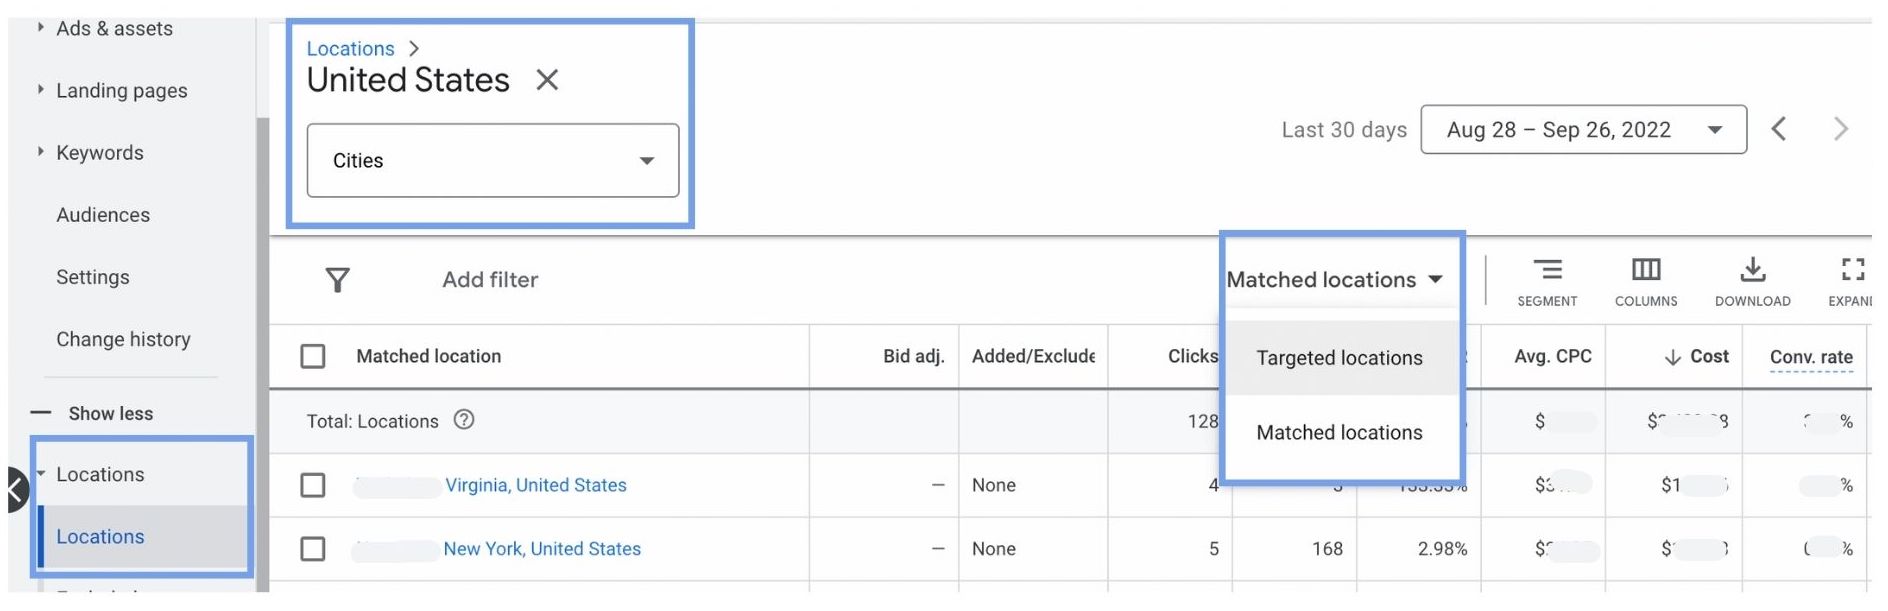
Sort the geography by cost to see where you’re spending your budget. Look for places with high spend but low CTR or low conversion rate. If your geo target is casting a wide net, you may be pulling in high-population areas where users are unlikely to convert due to simple proximity. If you were to remove a high-spending, low-performing geography target from your campaign, you would allow better-performing areas to spend that budget instead, and you’ll see an overall boost in results in turn.
Remember that with digital marketing, geography is not an exact science like it is with something like direct mail. People may live in one area, work in another area, and search from their mobile devices in a totally different area. For this reason, it’s unwise to try to be overly prescriptive to Google about where your target audience is. Rather, let the clear trends lead the way in any optimizations.
Optimizing Bid Strategy
While search term reviews and ad copy tuning should happen frequently, other optimizations like bid strategy changes are great for making a big, campaign- or account-wide impact. Big impact optimizations should be tested much less frequently and given ample time to fully show results.
Bid strategy testing can have a huge impact on your campaign’s performance—good or bad. By changing your bid strategy, you have the potential to refocus Google on a different goal for your campaign and drastically change performance. On the flip side, bid strategies affect all of a campaign, so any testing should be approached with the expectation that there will be some learning time and potential performance disruption. It’s probably not something you’d want to do during a critical period of the year, for example around the holidays for online retailers.
While you can completely change the bid strategy setting for your campaign, you can also make smaller tweaks for a more measured approach. For example, in campaigns where you’re targeting a certain cost per acquisition (CPA), you’ll want to occasionally review and adjust your CPA target to gradually guide Google towards a lower CPA. You don’t want to do this too dramatically as it could negatively impact your campaign’s visibility and results. However, small but gradual tuning will provide improved CPAs in the long-term.
Another opportunity for bid optimization is evaluating whether a campaign-level bid strategy is appropriate, or whether those settings should be broken down at the ad group level. Because you can set target CPAs at the ad group level, you can take advantage of that to fine tune your goals, especially if you want to keep ad groups together in a campaign but they tend to have vastly different CPAs. This way, you allow Google’s machine learning to treat the ad groups individually, rather than having the same target CPA for all of them.
Optimizing Impression Share
Impression share is how often your ads are shown to your target audience for your target keywords. It’s a metric that is often debated because it doesn’t directly impact performance, and can be leveraged by platforms and agencies to draw more budget out of advertisers.
Impression share goals should be viewed individually for your own industry, business goals, and campaigns. If you’re an e-commerce retailer with a product priced in the impulse-buy range, then a high impression share may not be instrumental in your campaign’s performance, because people may only need to see your ad result once to make a decision. However, if your business is one that has a long sales cycle and decision making process, your target audience may do dozens of searches before purchasing. In that case, the more you can stay present on the SERP and in front of your target audience, the more credibility and top-of-mindness you’ll grow.
With your individual business and goals in mind, you can review impression share periodically and make decisions about bid strategies, budgets, keyword and audience targeting, and more. Here’s how you can pull impression share data:
- Navigate to the campaigns view, and start here to see overall impression share. Impression share data can be viewed at the campaign, ad group, or even keyword level.
- In addition to the Impression Share column, there are more detailed columns that give additional context on your impression share. A good starting point are Search lost IS (rank) and Search lost IS (budget).
- First, review your overall impression share for the campaign. Then look at the reasons why you are losing impression share. If you’re losing impression share due to rank, you can address this with optimizations like improving quality score or fine tuning your bid strategy. If you’re losing impression share due to budget, you can address that by either adding more budget to the campaign or by reducing the keywords and/or geography you are targeting in that campaign.
Always Be Optimizing
One frequent challenge for Google advertisers is that they want to be doing more testing, or worse that their campaign is managed in a “set it and forget it” way. While you do want to approach campaign optimization in a strategic and gradual way, there is always something that you can be testing or fine-tuning to drive performance metrics higher and higher.
Since we covered a lot of information above, here’s a recap of the most important principles to apply to optimizing your Google Ads campaign:
- Evaluate quality over quantity (e.g. conversion rate over number of conversions).
- Find the area of greatest impact and opportunity, and start there with your optimizations.
- Limit how many changes and optimizations you apply at one time so that you can understand the impact of each change you make.
- Always use the data to make decisions and leave your assumptions at the door.
- Keep your business goals top of mind to ensure that your optimizations are working toward those goals.
Search News Straight To Your Inbox
*Required
Join thousands of marketers to get the best search news in under 5 minutes. Get resources, tips and more with The Splash newsletter: