Home / Blog / Introducing the Agital – GSC Percentage Change Chrome Extension for SEOs
Introducing the Agital – GSC Percentage Change Chrome Extension for SEOs

Published: July 31, 2024
Share on LinkedIn Share on Twitter Share on Facebook Click to print Click to copy url

Contents Overview
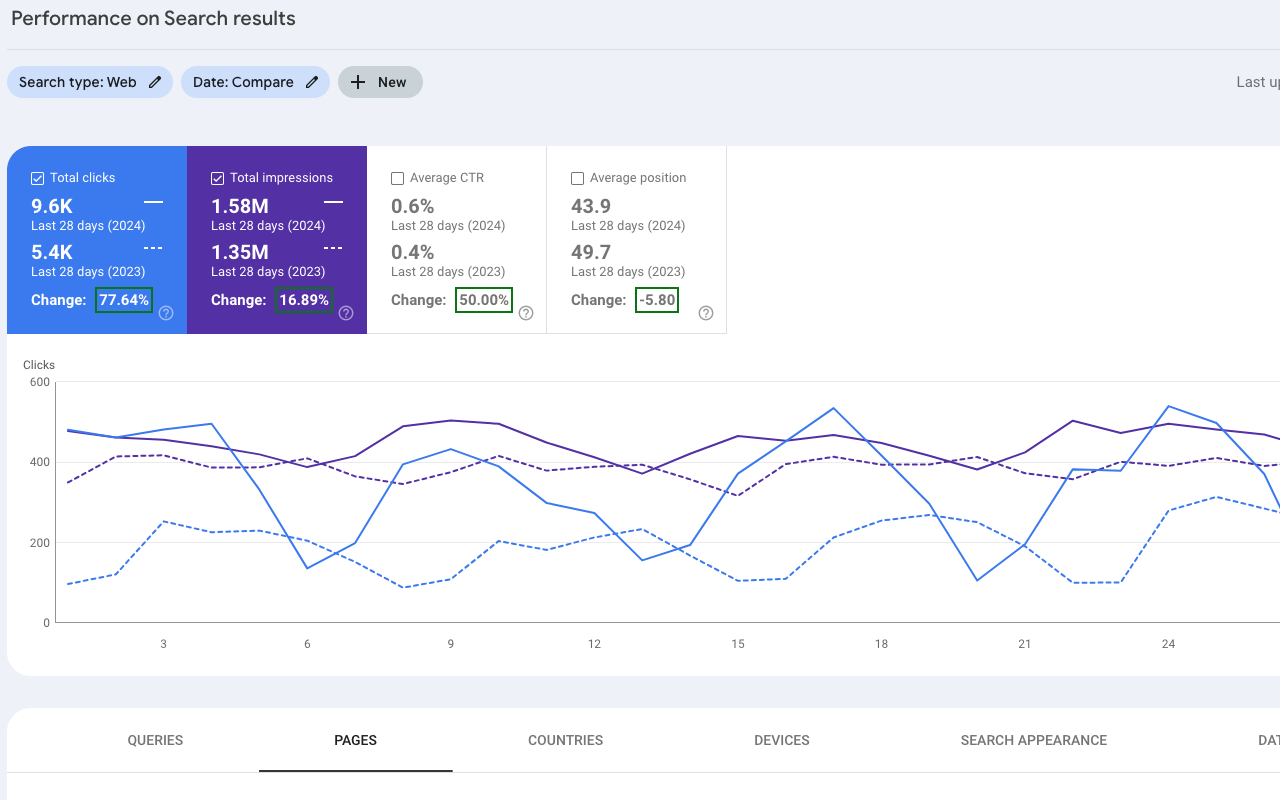
Google Search Console (GSC) is an invaluable tool for webmasters and SEO professionals. However, it has a significant limitation: GSC doesn’t display percentage changes when comparing site performance over two different periods. This lack of direct comparison makes it challenging to quickly report on improvements or declines in key metrics such as clicks, impressions, click-through rate (CTR), and position.
The Problem with Google Search Console Comparison Report
When using GSC to compare performance data across different time periods, users are presented with raw numbers without any indication of the percentage change. This means that, as a user, you need to manually calculate these changes to understand the full context of the data. For example, if your clicks have increased from 5,000 to 7,000, you have to do the math to realize that this represents a 40% increase. This manual calculation can be time-consuming and error-prone, especially when dealing with multiple metrics, large datasets, and hundreds of different domains.
The Solution: The Agital – GSC Calculations Chrome Extension
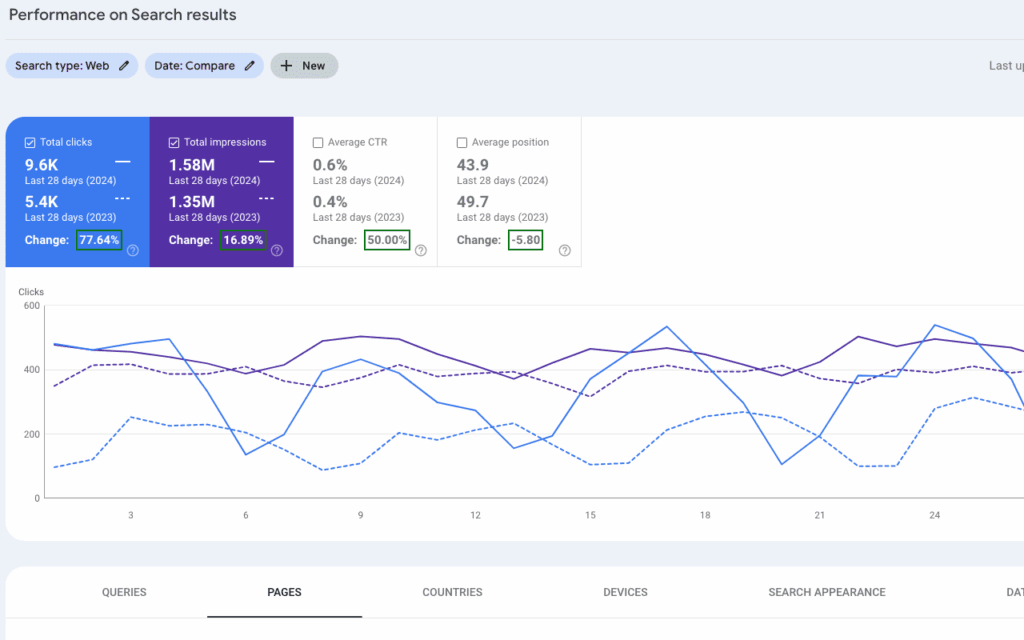
To address this issue, we followed our guide on how to use ChatGPT to help create an SEO Chrome extension and created one that automatically calculates and displays the percentage changes for key performance metrics in GSC. This extension enhances the GSC interface by adding the percentage and position change information directly within the performance report. It’s quickly become one of our favorite SEO Chrome Extensions.
You can download the Agital – GSC Calculations Chrome extension today!

Key Features of the Agital – GSC Calculations Google Chrome Extension:
- Percentage Change for Clicks, Impressions, and CTR: Instantly see the percentage increase or decrease in clicks, impressions, and click-through rates between two selected periods.
- Position Change for Average Position: Understand how your site’s average position in search results has improved or declined with a clear numerical difference.
- Visual Indicators: Positive changes are highlighted in green, while negative changes are shown in red, making it easy to quickly assess your performance.
Now it’s true that there are a number of other chrome extensions that add similar type functionality to GSC, but they often are feature heavy, difficult to navigate, and time consume to get the data you need. The GSC Chrome extension we created aimed to give you the numbers quickly and easily with a simple press of the button.
How We Built the Extension
Building the extension involved several steps, leveraging the capabilities of modern web development tools and ChatGPT’s assistance. Here’s a high-level overview of the process:
- Define the Requirements: We identified the need for displaying percentage changes in GSC and outlined the specific metrics to target.
- Collaborate with ChatGPT: Using ChatGPT, we drafted the initial code to fetch data from the GSC DOM, calculate percentage changes, and inject the results back into the GSC interface.
- Develop the Extension: We wrote the content script to extract the necessary data, calculate changes, and update the DOM. We also created the background script to handle the extension’s lifecycle and interactions. And a Manifest.json file describing the purpose, permissions, and actions of the extension.
- Test and Refine: Through multiple iterations, we tested the extension in various scenarios to ensure it accurately identified the most recent data points and displayed the correct information.
- Publish to Chrome Store: After thorough testing, we packaged the extension and published it to the Chrome Store, making it available for all users.
We’re big believers in the benefit of being able to create your own Chrome extensions to help make your SEO work faster and believe that knowing what’s in the code you run on your browser is important from a security perspective. Especially if the extension doesn’t need any third party data to function.
Here’s the code used to build the extension:
content.js
// Function to extract data from the DOM
function extractData(label) {
    console.log(`Extracting data for ${label}`);
    const elements = Array.from(document.querySelectorAll(`[data-label="${label}"] .nnLLaf`))
        .filter(el => el.offsetParent !== null); // Filter only visible elements
    if (elements.length < 2) {
        console.warn(`Not enough data points found for ${label}`);
        return { current: 0, previous: 0 };
    }
    const current = parseFloat(elements[0].getAttribute('title').replace(/,/g, ''));
    const previous = parseFloat(elements[1].getAttribute('title').replace(/,/g, ''));
    console.log(`${label} - Current: ${current}, Previous: ${previous}`);
    return { current, previous };
}

// Calculate percentage changes
function calculatePercentageChange(previous, current) {
    return ((current - previous) / previous) * 100;
}

// Calculate position difference
function calculateDifference(previous, current) {
    return current - previous;
}

// Function to add percentage change information to the DOM
function addPercentageChange() {
    console.log('Adding percentage changes...');

    // Clear previous data
    document.querySelectorAll('.percentage-change').forEach(element => element.remove());

    const clicksData = extractData('CLICKS');
    const impressionsData = extractData('IMPRESSIONS');
    const ctrData = extractData('CTR');
    const positionData = extractData('POSITION');

    const percentageChanges = {
        clicks: calculatePercentageChange(clicksData.previous, clicksData.current).toFixed(2),
        impressions: calculatePercentageChange(impressionsData.previous, impressionsData.current).toFixed(2),
        ctr: calculatePercentageChange(ctrData.previous, ctrData.current).toFixed(2),
        position: calculateDifference(positionData.previous, positionData.current).toFixed(2)
    };

    console.log('Percentage Changes:', percentageChanges);

    const metrics = [
        { label: 'CLICKS', change: percentageChanges.clicks, isPercentage: true },
        { label: 'IMPRESSIONS', change: percentageChanges.impressions, isPercentage: true },
        { label: 'CTR', change: percentageChanges.ctr, isPercentage: true },
        { label: 'POSITION', change: percentageChanges.position, isPercentage: false }
    ];

    metrics.forEach(metric => {
        const metricElements = Array.from(document.querySelectorAll(`[data-label="${metric.label}"] .m10vVd`))
            .filter(el => el.offsetParent !== null); // Filter only visible elements
        if (metricElements.length > 1) {
            console.log(`Adding change info for ${metric.label}`);
            const latestMetricElement = metricElements[metricElements.length - 1]; // Select the most recent visible element
            const percentageElement = document.createElement('div');
            percentageElement.classList.add('percentage-change');
            percentageElement.style.fontSize = '15px';
            percentageElement.style.fontWeight = 'bold';
            percentageElement.style.marginTop = '10px';
            percentageElement.style.color = 'inherit';

            const changeText = document.createElement('span');
            changeText.textContent = 'Change: ';

            const changeValue = document.createElement('span');
            changeValue.textContent = metric.change + (metric.isPercentage ? '%' : '');
            changeValue.style.border = '2px solid';
            changeValue.style.borderColor = (metric.label === 'POSITION')
                ? (parseFloat(metric.change) < 0 ? 'green' : 'red')
                : (metric.change.startsWith('-') ? 'red' : 'green');
            changeValue.style.padding = '2px';
            changeValue.style.marginLeft = '5px';

            percentageElement.appendChild(changeText);
            percentageElement.appendChild(changeValue);

            // Remove any existing percentageElement to avoid duplicates
            const existingElement = latestMetricElement.querySelector('.percentage-change');
            if (existingElement) {
                existingElement.remove();
            }

            latestMetricElement.appendChild(percentageElement); // Append to the most recent visible .m10vVd element
        } else {
            console.warn(`Not enough metric elements found for ${metric.label}`);
        }
    });
}

// Function to check for changes in the DOM and reapply calculations
function checkForChanges() {
    console.log('Checking for changes...');
    addPercentageChange();
}

// Initialize the script
function init() {
    console.log('Initializing script...');
    checkForChanges(); // Explicitly call checkForChanges when the script loads
}

// Execute the checkForChanges function when the script is loaded
init();
Combined with a background.js file:
chrome.action.onClicked.addListener((tab) => {
  chrome.scripting.executeScript({
    target: { tabId: tab.id },
    files: ['content.js']
  });
});
The Agital – GSC Calculations Chrome Extension is now available in the Chrome Store, making it easier for SEO professionals to gain deeper insights into their site’s performance without the hassle of manual calculations. Try it out today and streamline your SEO reporting process!

About Dan Hinckley
MORE TO EXPLORE
Related Insights
More advice and inspiration from our blog
How Home Goods Buyers Decide in 2026 Across Social, Search, AI, and Your Website
How home goods buyers discover, evaluate, and decide in 2026 across...
Kimberly Anderson-Mutch| December 19, 2025
5 Ways To Build Topical Authority For Your Website
What is topical authority and why does it matter? Learn 5...
Ryan Collins| December 18, 2025
AI Search Is Reshaping How Brands Win in 2026
Learn how AI search is changing SEO in 2026. See what...
Josh Kimble| December 11, 2025


