Table of Contents
We’ve always found SaaS companies to be extremely interesting clients to work with in terms of their digital marketing efforts. Since their business models are often congruent with higher margins, this allows them the flexibility of more aggressive marketing goals. Over the years at Go Fish Digital, we’ve worked with a large number of SaaS companies on their PPC & SEO efforts, and it’s often clear their teams want to move fast in terms of customer acquisition.
Related Content:
Knowing that these companies have aggressive advertising budgets, we thought it would be interesting to take a data-based look at how much SaaS brands tend to spend on these efforts. After all, platforms like Google Ads provide marketing Directors and VPs with a channel that’s immediately built for demand generation and user acquisition.
While we cannot know for certain how much these companies are spending on paid advertising efforts, there are tools that allow us to estimate advertising spend. SEMRush is a digital marketing solution provider (ironically a SaaS also in this study) that provides estimates of advertising keywords, traffic and costs. While this data will never reflect the exact advertising spend for these sites, we can use it to approximate the Google Ads spend of the companies in this dataset.
I’ll go into more detail about how the data was collected later. However, now let’s shift to the findings that our study revealed.
When looking at the data in aggregate, we were able to find some interesting data on how much traffic these sites were estimated to be getting and what the estimated annual traffic costs were:
- Avg Annual Traffic Cost: $1,311,768
- Avg Annual Traffic: 177,267 sessions
- Avg Monthly Keywords: 705
Top Spending Companies
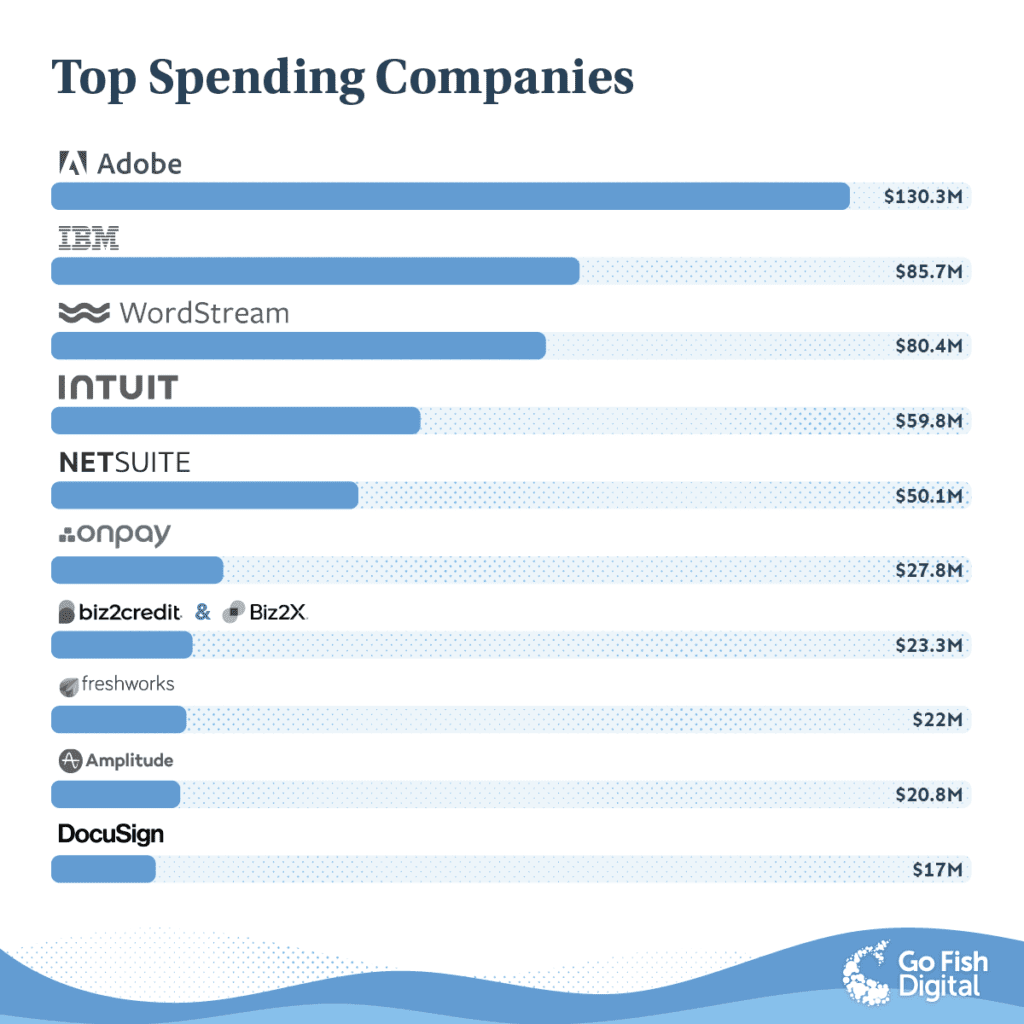
The first thing we wanted to analyze was the companies that simply had the most estimated spend.
Some of the results were immediately surprising. For instance, we weren’t expecting to see DocuSign in the top 10 results or companies like WordStream (PPC advertising software) surpass behemoths like Salesforce in terms of Google Ad spend.
Of course, taking a look at this list, it largely comprised of publicly traded companies, so we thought it made sense to segment this data out into two different lists.
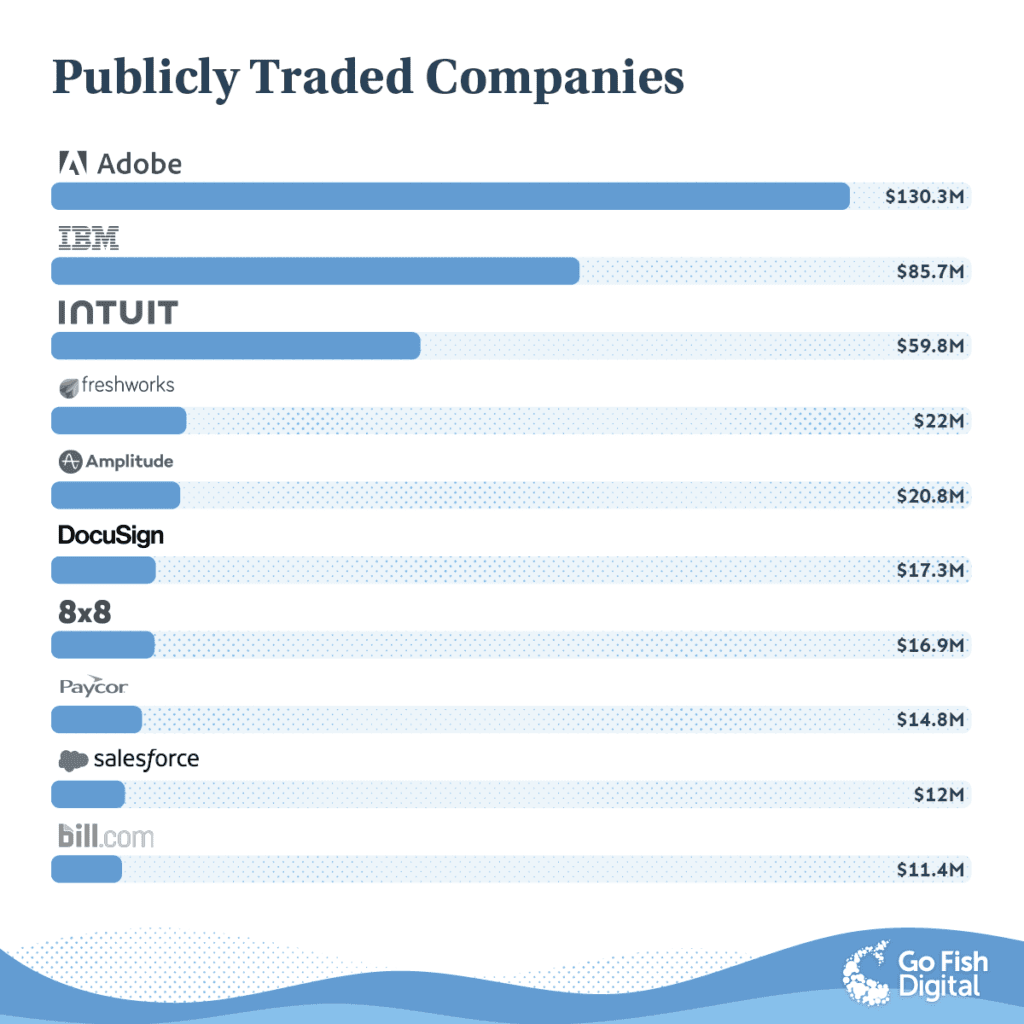
Publicly Traded Companies
First, we broke the data down into publicly traded companies. This reflects the estimated spend of a website that’s directly owned by a corporate entity that’s traded on the NYSE:
Adobe at the top of the list doesn’t come as a huge surprise given their business situation and large array of product offerings. However, it was more eye-opening to see more singularly focused companies like Bill.com and Freshworks so high up in terms of their spend levels.
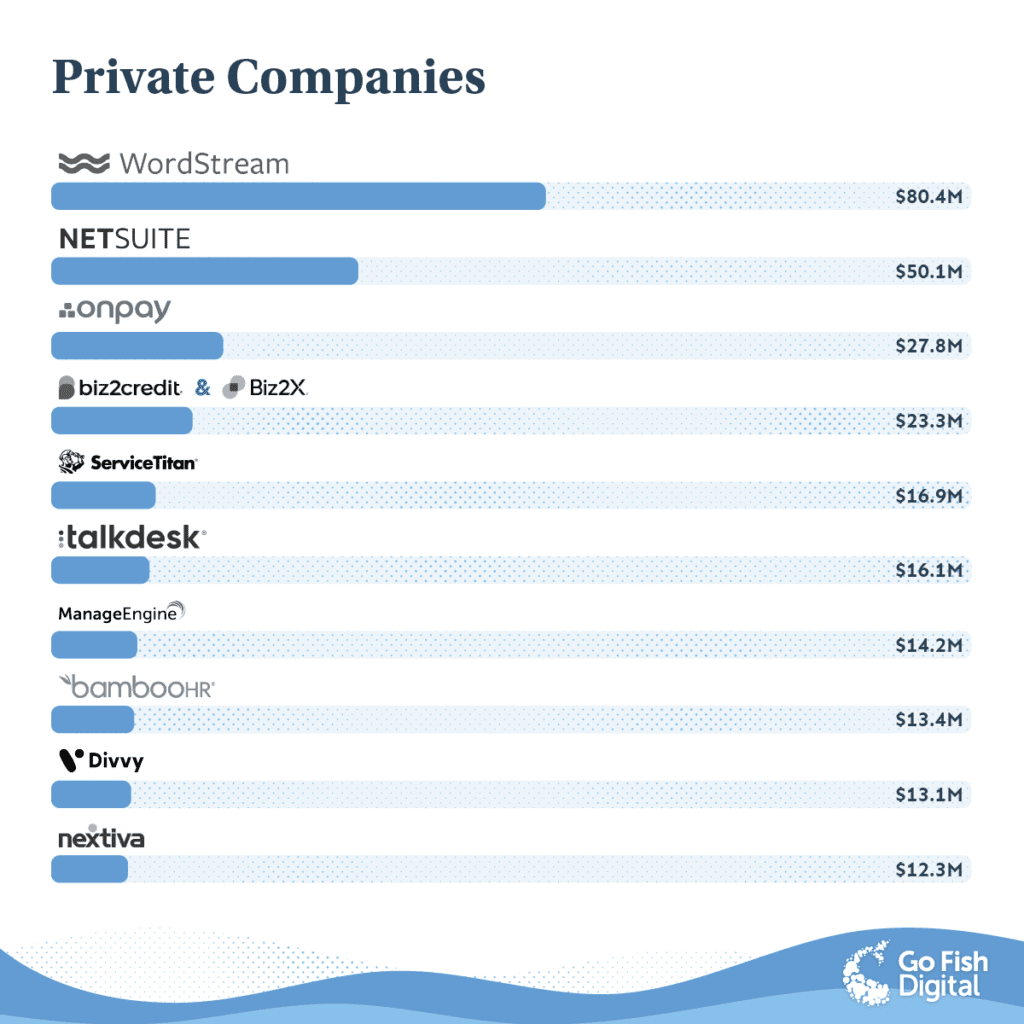
Private Companies
Next, we separated out private companies that aren’t publicly traded. This only reflects organizations who aren’t directly publicly and doesn’t take into consideration whether or not they are owned by a larger entity that is:
Top Industries By Spend
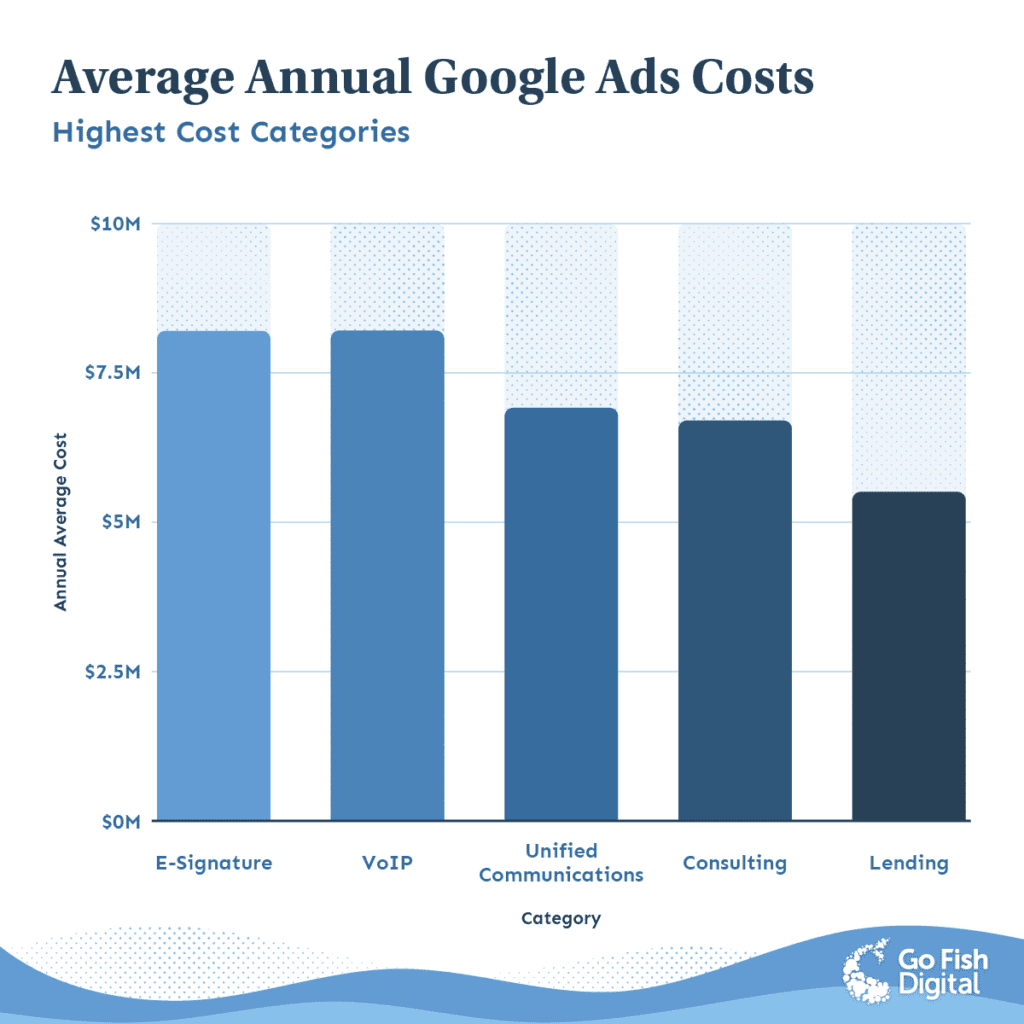
One of the most interesting views on the data was grouping the SaaS companies by industry and analyzing estimated Google Ads spend levels. After doing this, we were able to see trends for specific categories:
Minimum 4 companies per category found in the dataset
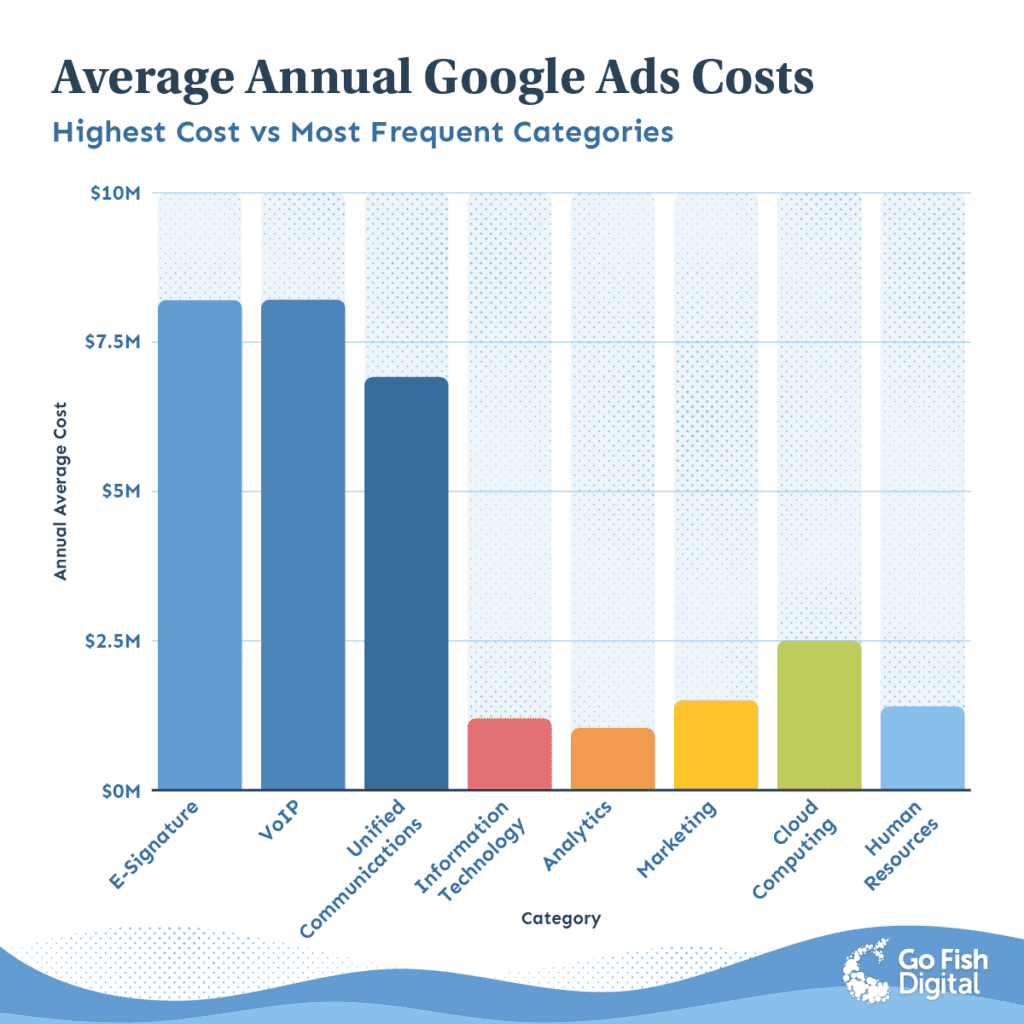
The most surprising takeaway from the data is just how competitive the E-Signature space is. We were shocked to learn that they’re spending over 2x in terms of advertising as companies in the CRM or Financial Services industries. DocuSign, PandaDoc, and HelloSign all come within the top 40 of Google advertisers in the dataset. If you want to learn from an industry where paid advertising is running rampant, look to the E-Signature space.
Most Popular SaaS Industries
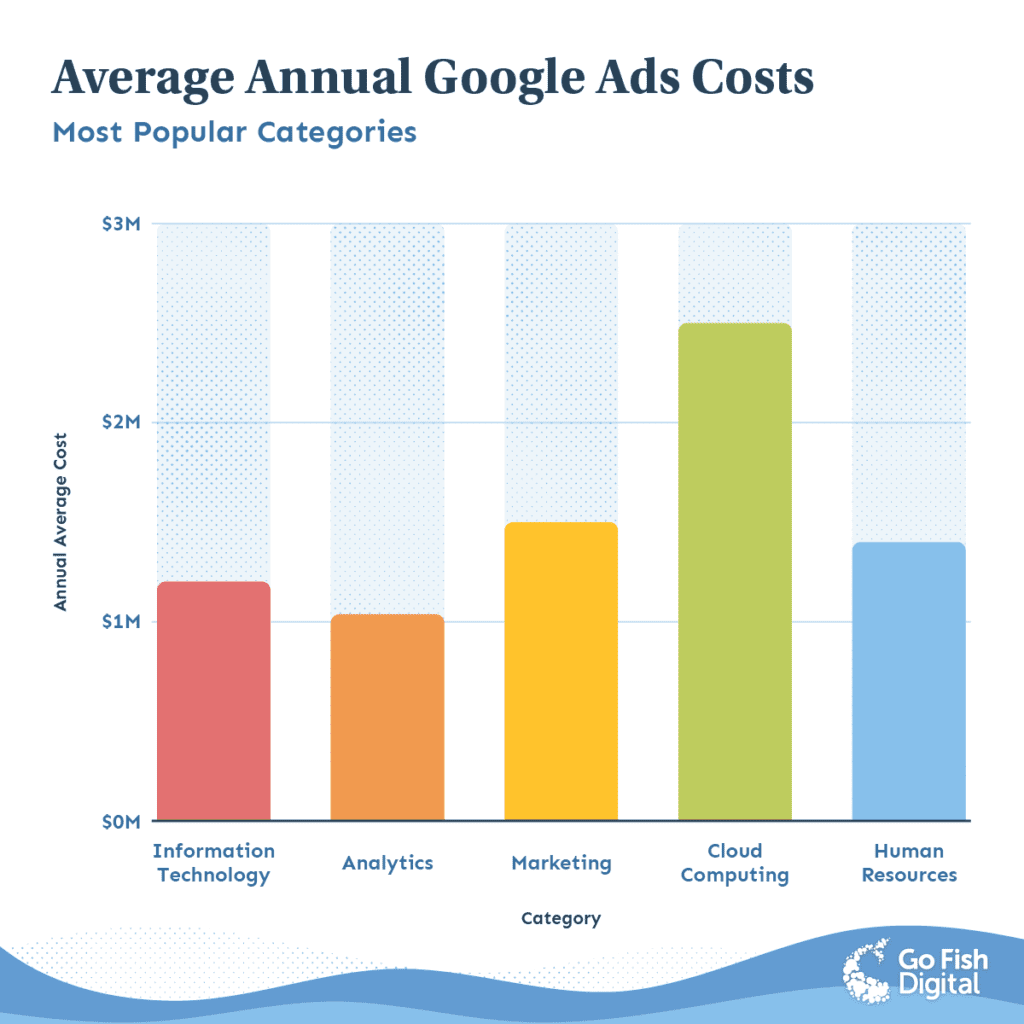
Conversely, here you can see the average Google Ads spend by the most popular categories: Information Technology, Analytics, Marketing, Cloud Computing and Human Resources. Note how “Cloud Computing” is the most competitive in terms of advertising budget.
However, this graph really puts in perspective the average spending levels of the top categories as compared to the most popular ones:
Review Your Competitors Spend Levels
Finally, we think one of the best use cases for this data is to better understand both your industry and individual competitors. With this data, you’ll at least have some benchmark data to see where you stack up in terms of digital marketing spending as compared to others who compete in your market.
To see the full list of companies we analyzed, you can access the data here: SaaS Google Ads Spending Sheet
About The Data
To gather this data, we utilized Crunchbase to build our list of companies from their database that they categorized under “SaaS”. As well, we also added companies & competitors we knew to be prominent brands in the SaaS industry.
After building our list, we were able to run these companies through a third-party tool called SEMRush to gather estimates on the estimated number of keywords, traffic and cost. Most of the above graphs utilize the “Traffic Cost” metric which comprises of “The estimated average monthly cost to rank for the listed keywords in Google Ads.” We excluded any sites that didn’t have Google Ads data to keep the study focused on companies that were estimated to be advertising.
Of course, there are some limitations to the dataset. These cost metrics are estimations of costs that are likely based on the company’s position in the Google Ads results and the estimated CPC (cost per click) of an individual query. As well, the data has a selection bias of those that were able to be exported from Cruchbase’s database and does not reflect every SaaS company.
Still, I believe this data is extremely useful to get estimates of how much SaaS companies are spending and which industries advertise more aggressively than others. This could be used a resource for companies to better understand their competitors and industries to get an idea of the digital marketing budgets of other SaaS players.
Search News Straight To Your Inbox
*Required
Join thousands of marketers to get the best search news in under 5 minutes. Get resources, tips and more with The Splash newsletter:
