Table of Contents
With the recent switch from Universal Analytics to GA4, many fundamental ways Google Analytics tracks website traffic have changed. As such, it is important to know what information you should track in GA4 and what each metric means. Whether you’re new to Google Analytics or are interested in optimizing your data tracking in GA4, we’ve compiled a list of the top 11 most important KPIs to track, what they mean, and why you should be tracking them.
Users
- What it is: Users are visitors who interact with your website or app. Users are counted uniquely, so one user who interacts with your website multiple times will still only count as one user. GA4 tracks both users and new users. “New users” are users who visited your site for the first time in your specified date range.
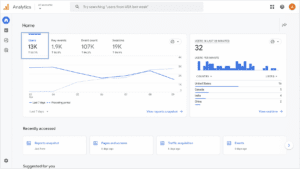
- Where to find it: The total number of users can be found on the homepage The date can be adjusted at the bottom of the card.
- Why it’s important: Looking at the total number of users on your site during a set time period can be a helpful overview of site traffic. User data is also segmented by behavior and demographics in GA4, allowing you to understand more about your audience as a whole.
Sessions
- What it is: Like users, sessions track your website traffic. However, while the users metric tracks a visitor to your website once (even if they visit the site multiple times), sessions track every time someone visits your site. GA4 has specific guidelines on how they track new sessions. In GA4, a session expires after 30 minutes of inactivity. If a user interacts with your website again after 30 minutes of activity, it will be counted as a new session. For more information on how GA4 tracks sessions, check out this article.
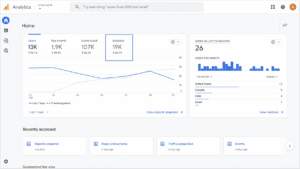
- Where to find it: Like users, you can find the total number of sessions on the homepage. The date can be adjusted at the bottom of the card.
- Why it’s important: Sessions provide context on how users engage with your site. Tracking sessions, particularly when combined with other metrics, helps you understand things such as how users are interacting with your site, conversions, and user retention.
Views per User
- What it is: Views per user tracks the average number of pages viewed per person.
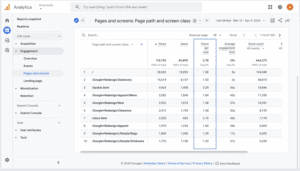
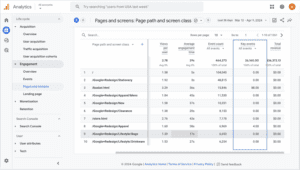
- Where to find it: The views per user can be found under the GA4 reports section by clicking on “Engagement” and then “Pages and screens.”
- Why it’s important: Knowing the average views per user helps you understand how much content users are consuming on your site before navigating away. Views per user can also be used to understand which pages encourage site visitors to continue navigating and engaging with your site.
Engagement Rate
- What it is: The engagement rate is measured as the percentage of engaged sessions out of total sessions. GA4 counts a session as an “engaged session” if it meets any of the following criteria:
- Lasts more than 10 seconds
- Includes a conversion
- Has at least 2 page views
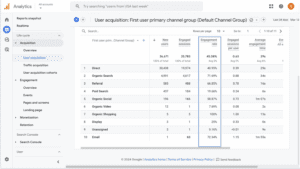
- Where to find it: Engagement rate data can be found under the GA4 reports section by clicking on “Acquisition” and “User Acquisition.”
- Why it’s important: Engagement rate provides insight into whether your content is reaching the right audience. High engagement rates indicate that site visitors are interacting with your website, while low engagement rates could signal that changes are needed to your site to effectively engage your audience.
Event Tracking
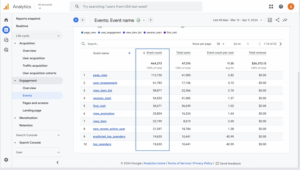
- What it is: Events occur when a user interacts with your website in some way. Some events are automatically collected in Google Analytics (such as page views or scrolling), while others are customizable to allow you to implement your own events to be tracked on your website.
- Where to find them: Automatically collected events are in the report section under “Events.” Manually created events will be found in the same location after being set up.
- Why it’s important: Events are the primary method of tracking used in GA4 and are highly flexible and customizable. Knowing what events are and how to use them properly will allow you to optimize them to your site’s needs.
Key Events [Previously Conversions]
- What it is: Key events are similar to events but are events that you specify as being important to your business. An example of a key event might be completing a form or generating a lead. You can define an event as a key event by going into admin, clicking on “Data Display,” then “Events,” and then toggling on the switch that says “Mark as Key Event.”
- Where to find them: You can see the number of key events that have occurred on each page of your site in the reports section under “Engagement” and “Pages and screens.”
- Why it’s important: Marking specific events on your site as “key events” allows you to see which parts of your site have a large impact on your business as a whole and which areas need improvement.
Session Key Event Rate [Previously Conversion Rate]
- What it is: The session key event rate is the percentage of sessions in which a key event is triggered. This was previously referred to as a conversion rate.
- Where to find it: Key event rates are not automatically visible in GA4, but they can be manually set up.
- Why it’s important: Tracking key event rates shows how effective your website is at getting users to perform desired actions. It can also be beneficial to see which parts of your website need to be improved based on user behavior.
E-commerce Data
- What it is: For businesses selling products on their websites, tracking e-commerce on your website is crucial to understand how visitors are making purchases. Some e-commerce measurements include:
- Add to Carts – The number of times that the add to cart event is triggered
- Items Purchased – How many items were purchased in total and per product
- Revenue – Revenue from items purchased (taxes and shipping not included)
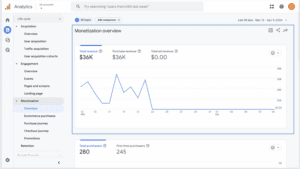
- Where to find it: E-commerce analytics are available in the reports section of Google Analytics under the “Monetization” section. E-commerce data includes multiple metrics to view revenue, items purchased, and items viewed. It also provides information on user journeys throughout your site, giving insight into how many people viewed a product, added it to their cart, proceeded to check out, etc.
- Why it’s important: Utilizing e-commerce data helps you optimize your products and website to your customers’ needs by understanding which channels are driving purchases, how users are navigating your site, which marketing efforts are effective, and what needs to be improved.
Traffic Source
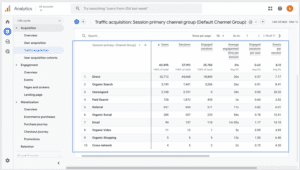
- What it is: Traffic source shows how users are coming to your site through various default channels. It indicates how users discovered your website, such as through email, advertising, social media, and more.
- Where to find it: Traffic source information is available in reports by clicking on “Acquisition” and “Traffic acquisition.”
- Why it’s important: Monitoring traffic sources helps you understand how users find your website. It allows you to identify which marketing channels are driving traffic to your site and how users engage with your content. This can help you make marketing decisions, such as whether more money and time should be spent on Google ads rather than social media advertising.
Landing Pages
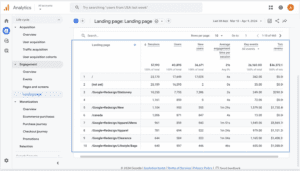
- What it is: A landing page is the page that users visit first when visiting your website. Examples of this could be your site’s homepage, a promotion page, or a blog post.
- Where to find it: Landing page information is available in reports by clicking on “Engagement” and “Landing page.”
- Why it’s important: Identifying key landing pages helps you understand where users are first seeing your content, giving you the opportunity to engage with them immediately upon entering your site. It can also help you evaluate the effectiveness of marketing campaigns or advertisements by seeing which pages of your site receive the most attention.
Tech Attributes
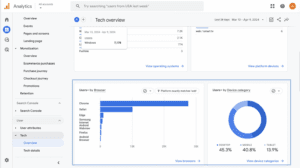
- What it is: Tech attributes provide insights into how users interact with your website across different devices, browsers, and platforms.
- Where to find it: Tech information is available in reports by clicking on “Tech” and “Overview.”
- Why it’s important: The way your website appears can differ based on the browser and type of device that it is viewed from. Understanding how most people view your website allows you to optimize your site accordingly, such as prioritizing your website design on mobile devices.
Conclusion
With the countless available metrics to track in GA4, picking which metrics to track can be overwhelming. Understanding the most important metrics to track and what they mean for your website can help you and your team optimize your analytics strategy and customize your analytics to best suit your business’s needs.
Search News Straight To Your Inbox
*Required
Join thousands of marketers to get the best search news in under 5 minutes. Get resources, tips and more with The Splash newsletter:
