


Website Heat Map Tool: Microsoft Clarity, The Ultimate Tool for UX and Conversion Success
Published: January 13, 2025
Share on LinkedIn Share on Twitter Share on Facebook Click to print Click to copy url

When optimizing your website for conversions and improving user experience (UX), data is your best friend. But while numbers and metrics can point to problems, they don’t always tell the full story. So, let me introduce you to Microsoft Clarity–a free, user-friendly tool that brings your data to life. This tool was launched in 2020 and offers heatmaps, session replays, and in-depth insights on how users interact with your website, giving you the visual perspective you need to make smarter UX decisions and boost conversions.
The Power of Microsoft Clarity: Key Feature Overview
Microsoft Clarity is all about understanding user behavior. The platform offers a suite of features that can transform your approach to UX design and conversion rate optimization (CRO). Here’s a closer look at how each feature plays a role in improving your site’s performance:
Heatmaps: Visualizing User Engagement
Heatmaps are one of Clarity’s main and standout features. They offer a visual representation of where users click, scroll, and linger on your site, helping you better understand which areas capture attention and which might need better optimization. Clarity offers four types of heatmaps, each designed to track different user behaviors:
- Click Heatmap: This shows where users click the most (and least) on your site and landing pages.
- Scroll Heatmap: Reveals how far users scroll down a page, helping you asses whether key content is being seen.
- Area Heatmap: Measures clicks within specific areas of a page for a more targeted perspective.
- Conversion Heatmap: Pinpoints the elements that drive purchases, this tool requires Shopify integration).
These heatmaps are invaluable for identifying navigation issues, optimizing content placement, and improving form completion rates. They also help you segment users by behavior, so you can tailor the experience to different audience needs.

Session Recordings: A Window Into User Journeys
Session Recordings in Microsoft Clarity provide a high-level view of how users interact with your website. Rather than capturing every detail, these recordings focus on aggregated, anonymized data to help identify patterns and trends. You can gain insights into how users navigate your site, where they encounter difficulties, and where they tend to drop off. This helps optimize the user experience by highlighting friction points and areas for improvement, all while ensuring that no personally identifiable information is tracked or recorded.
Key Benefits of Session Recordings include:
- Discovering Pain Points: Spot rage clicks, hesitation, or unexpected drop-offs.
- Summarized Recordings: Clarity utilizes Copilot AI to generate session summaries to highlight key moments or confusing navigation
- Real-Time Fixes: View live user interactions to address frustrations like non-responsive elements or confusing navigation.
- Dynamic Insights: Pause recordings to view heatmap data for specific states, like when a dropdown menu of pop-up is active.
This feature is an innovative tool for understanding how specific user groups interact with your site and identifying areas for immediate improvement.

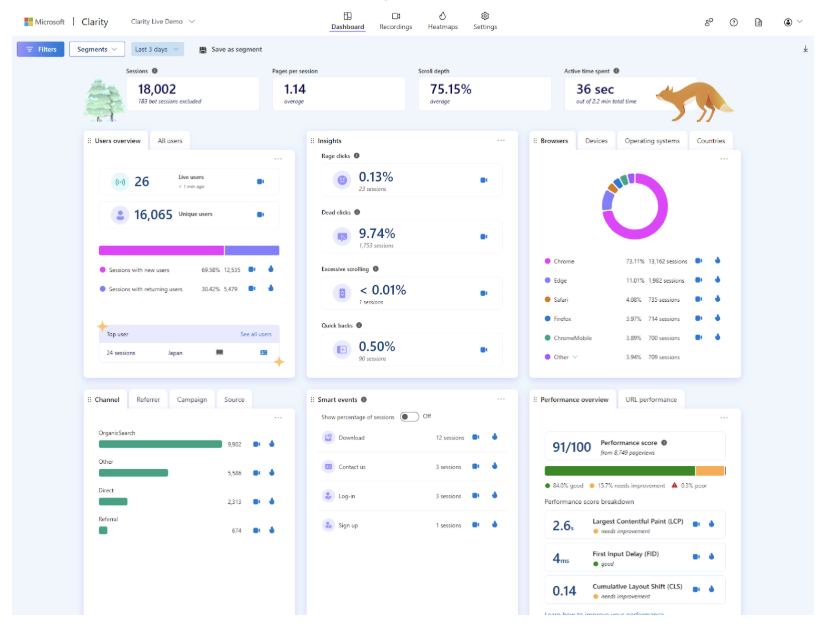
Insights Dashboard: From Data to Action
Clarity’s Insights Dashboard consolidates key metrics in one place, allowing you to pinpoint friction points and debug errors quickly. Some of the key metrics include:
- Rage Clicks: Where users rapidly click in frustration.
- Dead Clicks: Instances where users click but nothing happens.
- Excessive Scrolling: Moments when users scroll more than usual, signaling potential content placement issues.
- Quickbacks: When users navigate to a new page but immediately return, suggesting dissatisfaction.
Clarity offers over 40 filters, so you can drill down into specific user segments–by browser, session duration, or campaign–and uncover actionable insights.
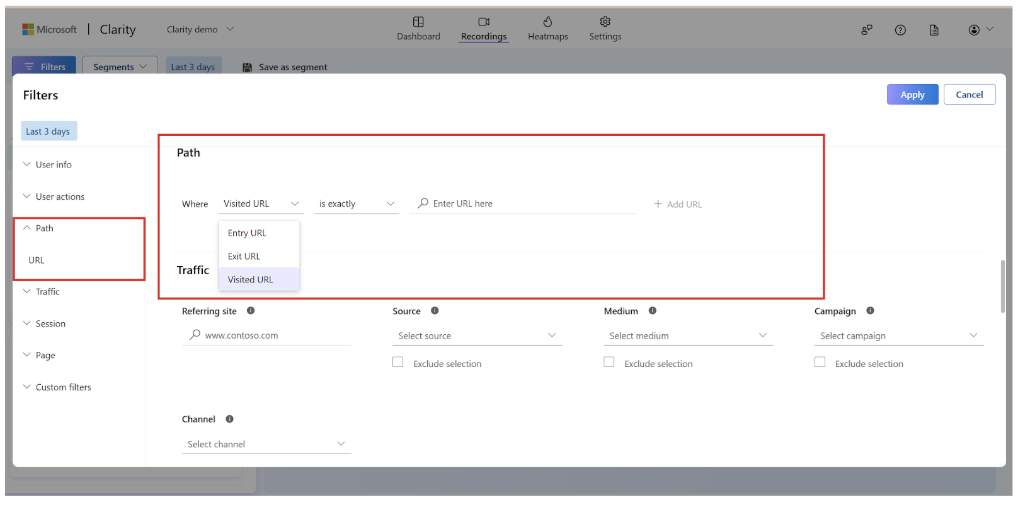
Smart Filtering and Event Tracking: Focus on What Matters Most
Clarity’s filtering and tracking capabilities simplify data analysis. With customizable filters, you can segment users by behavior, source, or technical details like browser types. Event tracking automatically tracks interactions like button clicks or URL visits, pairing them with heatmaps and session recordings for a holistic view.
For example, you can discover where users drop off during checkout or whether they engage deeply with your blog content. This feature makes it easier to spot patterns and take action.
Integration with Google Analytics: A Powerful Pairing
Microsoft Clarity and Google Analytics are a powerful duo for understanding user behavior. While Google Analytics excels in providing quantitative data—like the number of visitors, traffic sources, and conversion rates—Clarity dives into the qualitative aspects of user interactions. With features like session recordings, scroll-depth analysis, and heat mapping, Clarity allows you to see how users navigate your site and why they might be dropping off at certain points.
For instance, while Google Analytics can tell you that a specific page has a high bounce rate, Clarity can show you what users are doing on that page—whether they’re scrolling halfway down and leaving, struggling to interact with elements, or encountering usability issues. This qualitative insight fills the gaps left by GA, providing a fuller picture of user behavior and helping you make more informed optimization decisions.
Microsoft Clarity is a practical tool for identifying and addressing UX challenges that impact conversion rates. By leveraging its features, you can uncover user pain points, optimize content placement, and refine your site’s navigation. With its ability to provide actionable insights across devices and user segments, Clarity supports a continuous process of improvement, helping you create a smoother and more engaging user experience.
Using Microsoft Clarity for UX and Conversion Optimization
Microsoft Clarity isn’t just a tool for tracking user behavior—it’s a powerful resource for driving improvements in your site’s UX and conversion rates. By asking the right UX questions, you can leverage Clarity to identify friction points, optimize content placement, and refine your user journey.
Are Users Struggling with Key Steps on Your Site?
Every website has friction points where users get stuck. But how do you pinpoint them? Heat mapping tools like Microsoft Clarity can help answer this question by identifying where users are struggling through metrics like rage clicks and dead clicks. These behaviors highlight areas where users are frustrated or encountering problems.
For example, if you notice a high drop-off rate during form submissions, Clarity’s session recordings and heatmaps can provide insight into why users are abandoning the process. Are the instructions unclear? Is the form too long or confusing? By analyzing the data, you can make targeted improvements, such as simplifying the form, fixing broken links, or providing clearer instructions—ultimately reducing frustration and boosting conversions.
Is Your Content Placement Optimized for Engagement?
Do your visitors see the most important content on your page, or are they missing it? Clarity’s scroll heatmaps provide the answer. By tracking how far users scroll, you can evaluate whether your key content or calls to action (CTAs) are placed too far down the page. If they are, they might be overlooked.
For instance, Clarity can show you where users stop scrolling, which may indicate disengagement with content further down the page. With this knowledge, you can reposition high-value content—like CTAs or product highlights—closer to the top of the page, experiment with shorter page lengths, or reorganize layouts to keep users engaged and naturally guide them down the page.
Are You Optimizing for Mobile Users?
With mobile traffic often surpassing desktop, ensuring your site is mobile-friendly is more important than ever. But how can you identify specific mobile UX issues? Clarity’s filtering options allow you to analyze user behavior across different devices, helping you uncover mobile-specific pain points, like difficult navigation or misaligned elements.
For example, Clarity can reveal if mobile users are struggling with navigating a dropdown menu or interacting with a misaligned button. With this insight, you can optimize your site’s layout and content placement to improve the mobile experience. Whether it’s adjusting button sizes, simplifying navigation, or refining mobile-friendly forms, Clarity helps you create a seamless experience for users across all devices.
By asking the right UX questions and using Microsoft Clarity’s features, you can gain valuable insights into how users interact with your site. Whether it’s identifying friction points, improving content placement, or optimizing for mobile, Clarity helps you understand user behavior in a more actionable way. With this understanding, you can make informed adjustments that improve the user experience, reduce drop-offs, and create a more seamless journey for your visitors.
Clarity vs. Other Analytics Tools: Why It Stands Out
What makes Microsoft Clarity truly stand out is its cost—it’s entirely free. Unlike paid tools like Hotjar or Quantum Metric, which often come with hefty price tags, Clarity offers robust features like heatmaps, session recordings, and filtering capabilities without any subscription fees. While paid tools might offer advanced features like customizable reports and real-time analytics, Clarity delivers essential insights that are perfect for businesses on a budget or those just beginning to explore user behavior analysis.
Here’s a quick comparison of Clarity with some other popular analytics tools:
While paid tools like Hotjar, Heatmap.com, and Quantum Metric offer advanced features suited for enterprise needs, Microsoft Clarity stands out as a free, accessible option that delivers essential insights for understanding user behavior. Its combination of heatmaps, session recordings, and filtering capabilities makes it an excellent starting point for businesses looking to improve their UX without a significant upfront investment. Whether used independently or alongside tools like Google Analytics, Clarity provides a strong foundation for data-driven optimization.
Transform Your Website with Microsoft Clarity
Microsoft Clarity serves as a valuable tool for ongoing improvement, helping businesses refine their user experience and boost conversions over time. With features like heatmaps, session recordings, and filtering options, it provides actionable insights to address pain points, optimize layouts, and improve user journeys. Using Clarity regularly can support a cycle of testing, learning, and enhancing your site to meet evolving user needs.
Microsoft Clarity isn’t just a tool—it’s a partner in the ongoing process of refining your website. As you explore heatmaps, session recordings, and filtering options, you begin to uncover the nuances of your users’ experiences. These insights help you address pain points, optimize layouts, and make informed decisions that improve your site over time.
By using Clarity regularly, you create a continuous cycle of testing, learning, and adapting to meet the evolving needs of your users. It’s not about quick fixes; it’s about making gradual, meaningful improvements that build a better, more intuitive website. So, if you’re ready to take your website’s user experience to the next level, start by exploring Microsoft Clarity. With each insight you gain, you’re one step closer to delivering a seamless experience that drives conversions and keeps your users coming back.