Table of Contents
Google Analytics 4 (GA4) uses dashboards to organize and visualize insights for a business.
However, you will likely find the default dashboards in GA4 to be broad, cluttered, and lacking the relevant information you want to track. Setting up custom dashboards in GA4 can save you time and allow you to display your desired business insights.
Related Articles:
Getting Started
To make these custom dashboards, you can use the Customize report feature. This feature allows you to pick specific information you want to display and monitor in a dashboard by building filters. You can then save these filtered dashboards and add them to the navigation panel to make it easy for your team members to also view your customizations. In order to utilize the Customize report feature, you must have admin or editor access to GA4.
Creating a Customized Dashboard
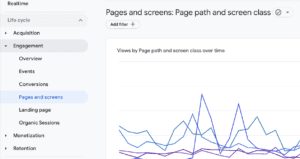
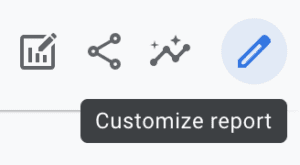
To start, pick the dashboard you want to customize. For the following examples, I choose the Pages and screens dashboard. Then, click the Customize report button in the top right corner.
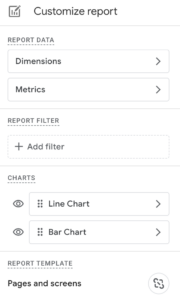
Next, select the Add filter button. This button will direct you to the Build filter tool. In this tool, you can create up to 5 filters for your dashboard. As of August 2023, the Build filter tool now uses match types when filtering dimensions.
Longtime UA users will recognize the match types as they are finally brought over to GA4:
- Exactly matches
- Contains
- Begins with
- Ends with
- Matches regex
- Matches partial regex
- Does not exactly match
- Does not contain
- Does not begin with
- Does not end with
- Does not match regex
- Does not match partial regex
The following three examples demonstrate how to use the Build filter tool to make a dashboard that is right for you.
Example 1: Filter by Subfolder
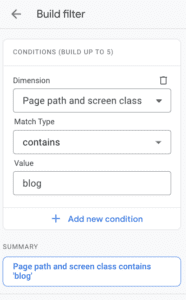
If your site includes a blog, a helpful custom dashboard to create would specifically display blog post performance. To set up this custom dashboard, I selected the filter dimension of Page path and screen class, set the match type to contains, and then entered ‘blog’ in the value box.
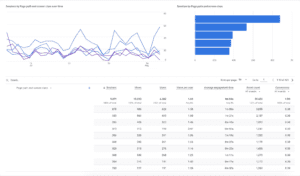
After applying this filter, my dashboard was updated to display just the performance of blog pages.
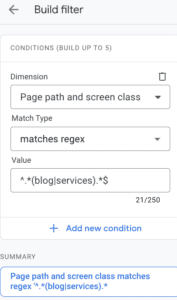
A possible circumstance you might come across when filtering by subfolder is filtering for multiple values. For example, I might want to filter for both blog and services pages.
To achieve this, I first went back into the Build filter tool and chose the Page path and screen class dimension. I then selected the match type of matches regex. To look for blog or services pages, I used the regex of ^.*(blog|services).*$.
In addition to adding filters, you can also remove or add metrics and dimensions.
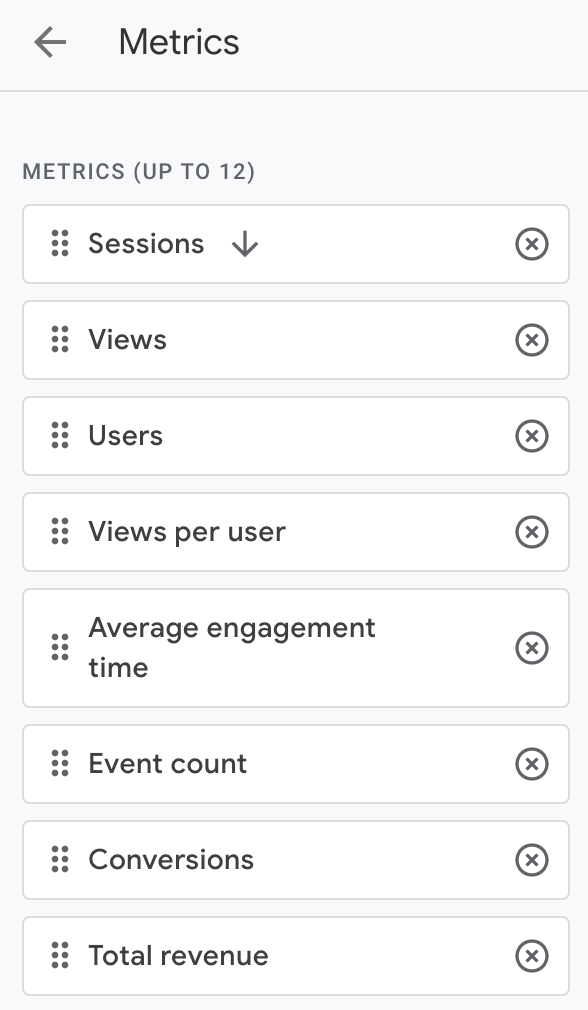
In the list of already added metrics, you will notice one of the metrics listed has an arrow. This metric is the primary metric.
The default primary metric for my dashboard is Views. For my blog post report, Sessions makes more sense as the primary metric. To change the primary metric, I searched for my new metric Sessions in the drop-down menu called Add metric.
Then, I dragged my new metric to the top of the list and clicked on the metric. You will know you completed this step correctly if the chart titles on your dashboard start with the name of your primary metric. In this case, my chart titles start with “Sessions by.”
In this example, I also want to remove a metric. It does not make sense to include the Total revenue metric in my dashboard as the blog posts make no revenue. To remove this metric, I simply clicked the x next to Total revenue and applied the change to my dashboard.
Saving Your Customized Dashboard
After making all your customizations, remember to save your work. You can either save all changes to the existing report or save them as a new report. The better option in most cases is to save your customized dashboard as a new report. This way you still have access to the original dashboard. All new reports can be found in the Library tab under Reports.
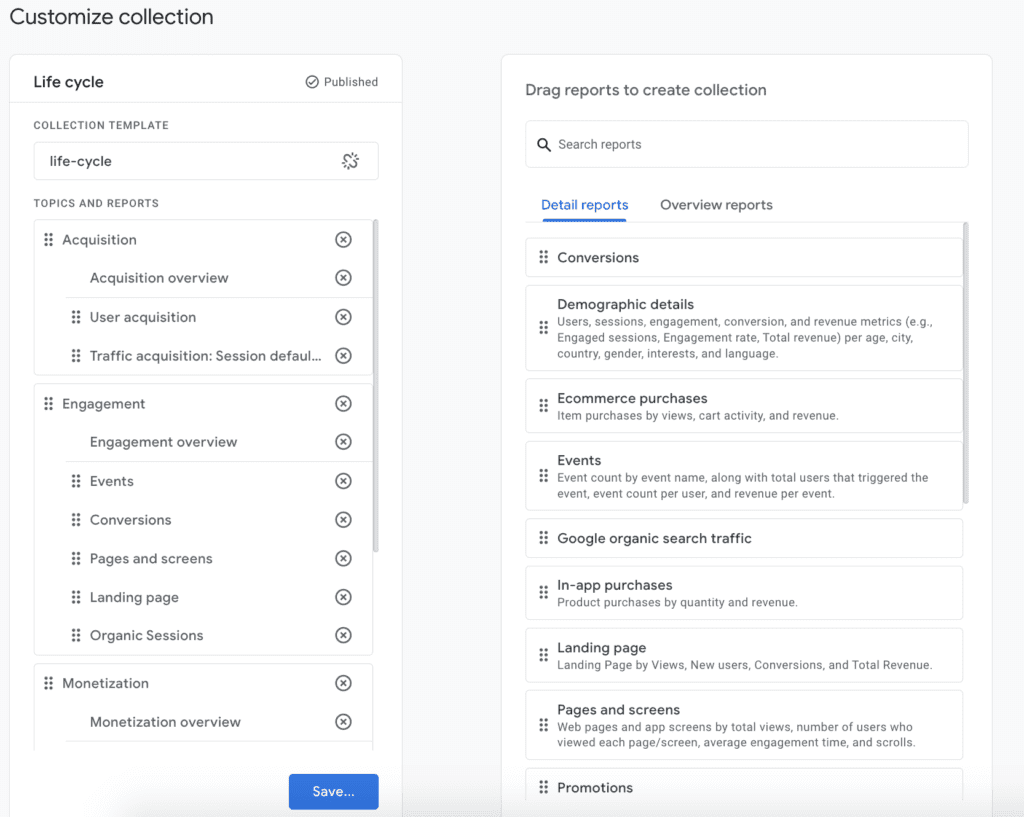
Each report created can be added to a collection. GA4 automatically creates the Life cycle and User collections. To add your customized reports to an existing collection, first find the collection in the Library panel and click Edit collection. Then, you find the report you just customized by searching in the right-side menu. Once you find your report, you drag the report and add it to the collection panel. Remember to hit Save so your customized report will appear under the collection in the left sidebar navigation panel every time you open GA4.
You can also add your customized reports to a new collection. After creating a new collection, make sure to publish the collection so your new collection and customized dashboards will appear in the navigation panel.
Example 2: Audiences
A likely dashboard you will want to create is one customized for a specific audience. If you already have created specific audiences in GA4, you can make audience-specific dashboards with the Customize report tool. If not, you can first create a custom audience under the Audiences section in Admin.
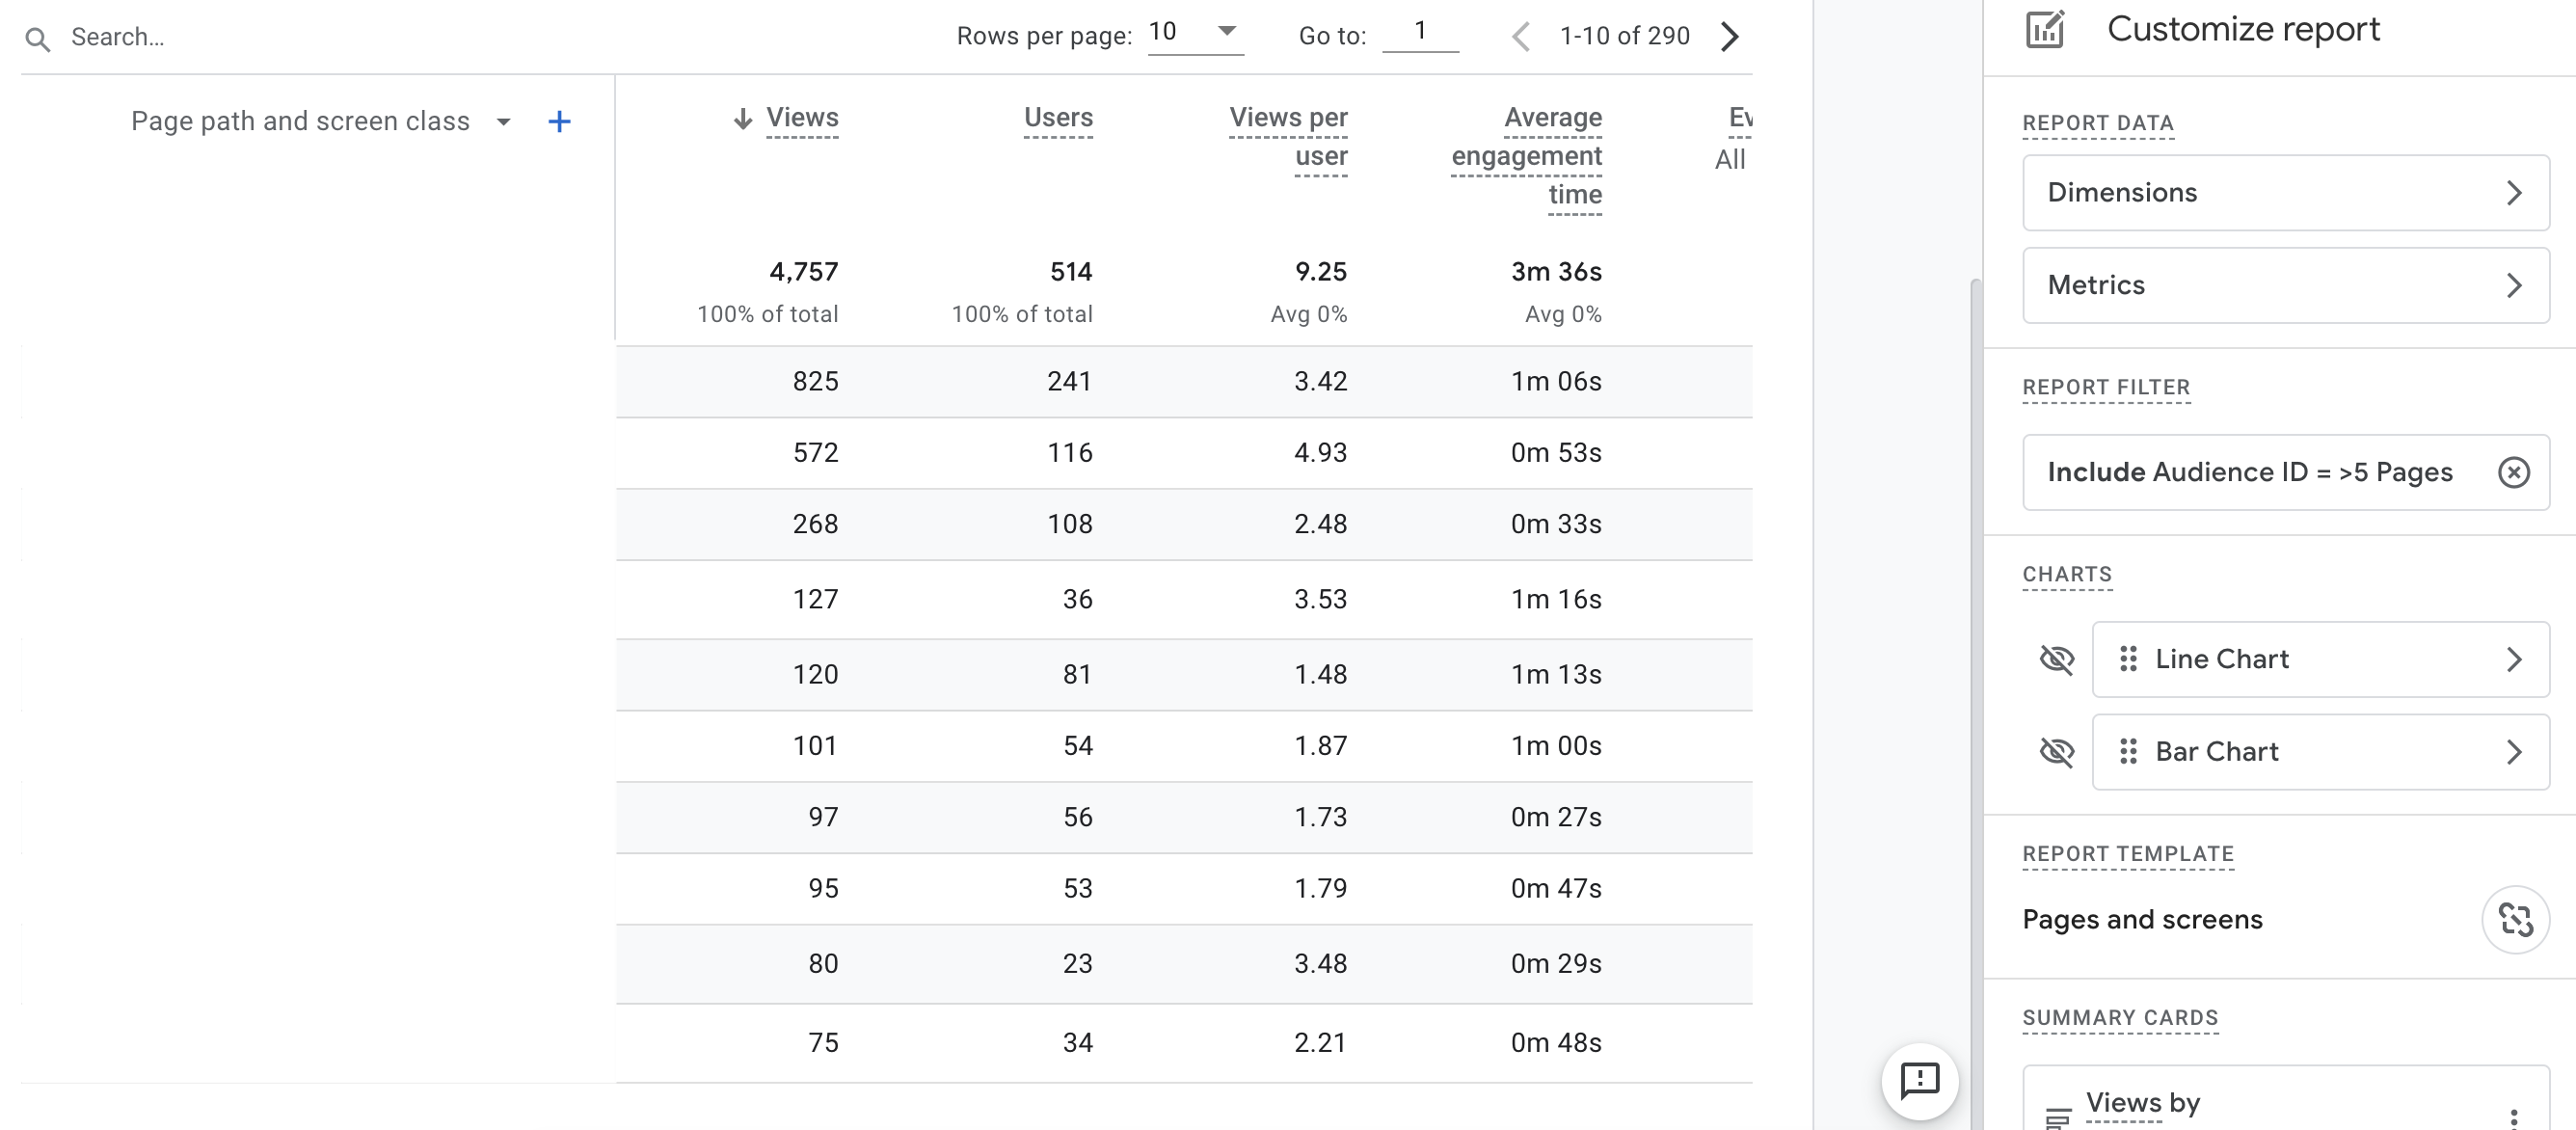
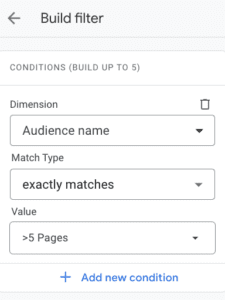
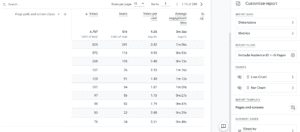
Similar to the blog post example, you again use the Build filter option. For the filter dimension, I chose Audience name, for the match type I selected exactly matches, and for the value, I selected the premade audience my team created of people who viewed five or more pages in one site session.
You might find that one or multiple of the default dashboard charts are not necessary and make your dashboard cluttered. For this example, I hid the line and bar chart visuals from the board in the Charts section of Customize report.
Remember to follow the steps for saving your dashboard as listed above!
Example 3: Subdomains (AKA Views)
Another beneficial custom dashboard to create is one for a specific subdomain. Universal Analytics veterans remember the Views for separating subdomains. That, unfortunately, is not available in GA4 for non-360 users.
Websites often have subdomains for various sections, from blogs to careers. A possible first step for you would be getting a list of all your subdomains and analyzing which of your subdomains perform the best.
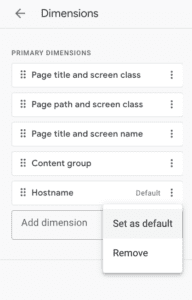
You can do this by going to the Customize report tool, selecting Dimensions, and then searching for the Hostname dimension in the Add dimension box. Once you add Hostname to your dimensions list, click on the three dots next to Hostname and select Set as default. Your dashboard will then update to show a list of all your subdomains.
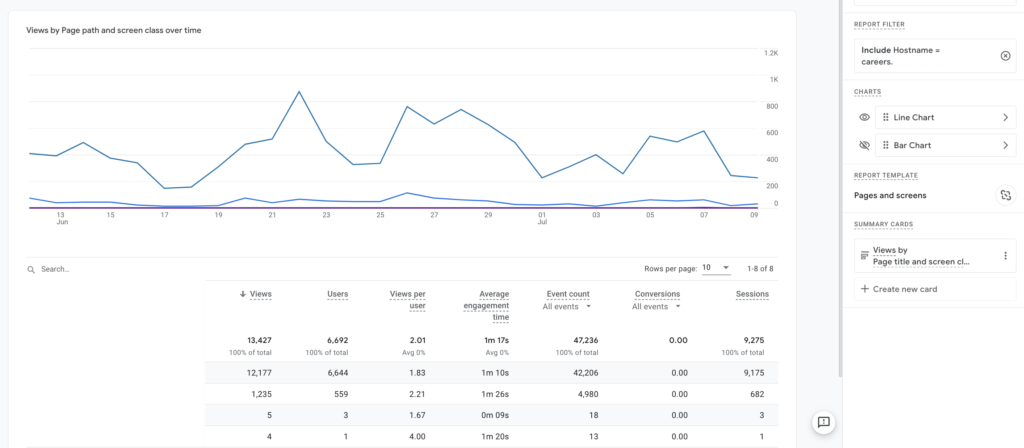
After evaluating the overall performance of your subdomains, you might be curious to see more information about a specific subdomain. In this example, I want to know which pages perform best on the careers subdomain.
To do this, I first set the default dimension to Page title and screen class. I then went to the Build filter tool and selected the Hostname dimension. Next, I chose a match type of exactly matches, selected the careers subdomain from the drop-down values menu, and hit Apply. I now have a dashboard specific to pages from the careers subdomain.
Conclusion
Creating custom dashboards in GA4 allows you to view the information most relevant to your interests and goals. By setting up custom dashboards, you no longer have to spend unnecessary time searching for specific insights every time you use GA4.
With so many possibilities for filters, it may take time to find the best filters that work for your dashboard. Next time you open GA4, explore the custom dashboard options and find the setup that works best for you and your team.
Search News Straight To Your Inbox
*Required
Join thousands of marketers to get the best search news in under 5 minutes. Get resources, tips and more with The Splash newsletter:
