Table of Contents
A Brand Penetration System To Generate Indices Using Brand Detections From Geo-Located Images And Corresponding Locations
It looks like when Google Gets into Brands; It does it in a big way – trying to identify all the Brands it can
This patent relates to determining measures of brand penetration over geographic regions. The patent is about a brand penetration determination system and methods to generate indices based on many brand detections from many geo-located images and corresponding locations within various partitioned sub-regions.
Related Content:
- Technical SEO Agency
- Ecommerce SEO Agency
- Shopify SEO Services
- Franchise SEO Agency
- Enterprise SEO Services
Image content analysis engines were developing and deployed to detect many objects and entities. Data obtained from these engines can get processed for later retrieval and analysis, spanning many applications and carrying a heavy computational load. As such, more technology gets needed to provide valuable data associated with analyzed images and related content while minimizing costs of storing such data, including, for example, the amount of computer memory required to keep such data.
The Advantages of The Brand Penetration Patent
This brand Penetration patent:
- Determines brand penetration across a geographic area. It includes splitting, by computers, a geographic area into two or more sub-regions
- Decides from images captured at sites within each sub-region, many detections of a brand within each respective sub-region
- Generates a brand penetration index for each sub-region by the computers. The brand penetration index is based on the number of detections in the respective sub-region
- Stores the brand penetration index for each sub-region in memory in association with an indicator of the respective sub-region
- Includes a geographic sub-region determination system configured to partition a geographic area into two or more sub-regions
- It contains an image content analysis engine configured to determine, from images captured at sites within each sub-region, many detections of a brand within each respective sub-region
The Brand Penetration Index
The brand penetration index is based on the number of detections in the respective sub-region weighted by a population factor based on a population within the sub-region or a category factor based on a category of goods associated with the brand.
The geographic sub-region determination system can tell, in splitting the geographic area into two or more sub-regions, the number of sub-regions and boundaries of each sub-region to ensure that the population within each sub-region is above a threshold.
The computer also includes tangible, computer-readable media configured to store the brand penetration index for each sub-region associated with an indicator of the respective sub-region.
The operations also include:
- Splitting a geographic area into two or more sub-regions
- Determining from images captured at sites within each sub-region, many detections of a brand within each respective sub-region
- Generating a brand penetration index for each sub-region – based on the number of detections of the brand in the respective sub-region
- Storing the brand penetration index for each sub-region in memory that is associated with an indicator of the respective sub-region
- Deciding on an electronic content item associated with the brand based at least in part on the brand penetration index for a given sub-region of the two or more sub-regions. That electronic content item gets configured for delivery to and displays on an electric device associated with the given sub-region
The Brand Penetration patent is at:
Brand penetration determination system using image semantic content
Inventors: Yan Mayster, Brian Edmond Brewington, and Rick Inoue
Assignee: Google LLC (Mountain View, CA)
US Patent: 11,107,099
Granted: August 31, 2021
ed: July 12, 2019
Abstract
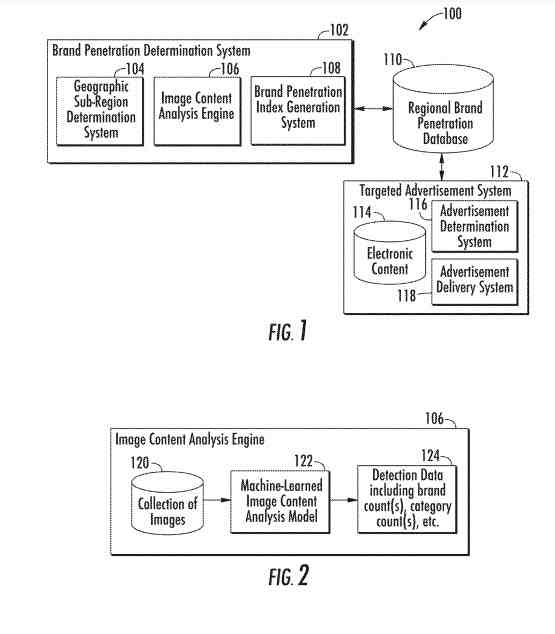
Example embodiments of the disclosed technology install a brand penetration determination system using image semantic content. A geographic sub-region determination system gets configured to partition a geographic area into two or more sub-regions.
An image content analysis engine gets configured to determine, from images captured at sites within each sub-region, many detections of a brand within each respective sub-region.
A brand penetration index generation system becomes configured to generate a brand penetration index for each sub-region based on the number of detections of the brand in the respective sub-region weighted by factors (e.g., population factor, category factor, etc.), which becomes stored in memory with an indicator of each respective sub-region.
In splitting the geographic area into two or more sub-regions, the number and boundaries of sub-regions get determined to ensure that the population within each sub-region is above a threshold.
Google May Use An Image Content Analysis Model to Detect a Brand
How might Google decide whether there is a brand associated with a geographic region?
- It can use an image content analysis model to determine brand detections from many geo-located images
- Brand penetration indices and related measures can then become generated based on brand detections and corresponding partitioned locations.
- A brand penetration determination system can get configured to determine a distribution of two or more discretized sub-regions within a geographic region.
- An associated measure of brand penetration can get determined. Sub-region numbers and boundaries can become committed to ensure that a population within each sub-region is above a threshold.
Why Population is above Thresholds for Sub-Regions
By ensuring that the population of each sub-region is above that threshold, a computational burden imposed in storing statistically relevant brand indices for each sub-region gets reduced. Besides, by ensuring that only brand indices for sub-regions having a statistically significant number of inhabitants get stored, the disclosed systems and method can provide valuable data associated with an imagery corpus while simultaneously minimizing the costs of holding that data in memory.
This technology can allow a user to make an election when systems, programs, or features described herein may enable the collection of user information. That is specific information about a user’s current location, social network, social actions or activities, profession, a user’s preferences, or other user-specific features. It also covers images from computers associated with a user and controls data indicating whether a user gets sent the content or communications from a server.
Personally Identifiable Information
Besides, specific data may become treated in ways before it becomes stored or used to remove personally identifiable information. For example, a user’s identity may get treated so that no personally identifiable information can get determined for the user, or a user’s geographic location may become generalized where location information gets obtained (such as a city, ZIP code, or state level) so that a particular area of a user cannot get determined.
Thus, the user may control what information gets collected, how that information is used, and what information is provided. In other examples, images and content determined from such photos under the disclosed techniques can become treated to ensure that personally identifiable information such as images of people, street names and numbers of residences, and other personal information gets removed.
Determining A Measure Of Brand Penetration Across A Geographic Region
A computer comprising processors can help install aspects of the technology, including a brand penetration determination system. In general, the brand penetration determination system can get configured to determine a measure of brand penetration across a geographic region. The brand penetration determination system can include:
-
- A geographic sub-region determination system
- An image content analysis engine
- A brand penetration index generation system
How A Geographic Sub-Region Determination System Works
A geographic sub-region determination system can split a geographic area into sub-regions.
Sub-regions can correspond, for example, to discretized cells within the geographic region that can have predetermined or dynamically determined sizes and boundaries based on desired measures of brand penetration.
The brand penetration determination system can become configured to divide the geographic area into two or more sub-regions, each sub-region boundaries according to particular cell size and a particular geographic partitioning.
For example, partitioning a geographic area into sub-regions could correspond to implementing a grid imposed over the geographic area.
Each cell in the grid can become characterized by a given shape, and these can include a square, rectangle, circle, pentagon, hexagon, or another polygon.
The Dimensions can characterize each grid cell. They can look at a width, length, height, and diameter dimension. They can also have a predetermined or dynamically determined distance. That can become a value measured in meters, kilometers, miles, or another suitable variable. Or it can become a grid of cells corresponding to respective sub-regions that can become uniform in size, while the cells can vary in size in other embodiments.
Configuring the Geographic Sub-Region Determination System
The geographic sub-region determination system can get configured to determine, in splitting the geographic area into two or more sub-regions, the number of sub-regions and the boundaries of each sub-region to ensure that the population within each sub-region is above a threshold.
When sub-region boundaries are uniform in size (e.g., as in the form of a uniform grid of cells) or when they become predetermined in size (e.g., corresponding to predetermined geographic partitions such as those corresponding to zip codes, neighborhood boundaries, town/district boundaries, state boundaries, country boundaries, etc.), the number of sub-regions can get reduced by excluding sub-regions whose population does not exceed the threshold.
The population here can correspond to many people within a given geographic area, such as census data or other predefined databases associated with a geographic area.
In this example, when ensuring that the population within each sub-region is above a threshold, the geographic sub-region determination system can determine the number and boundaries of each sub-region.
Each sub-region has a population defined by a threshold corresponding to a number (x) of people in each sub-region.
Why Have A Geographic Sub-Region Determination System?
Referring to the geographic sub-region determination system, the population described can correspond to a determined number of goods associated with people in a given geographic area, such as many homes, vehicles, businesses, electronic devices, or particular categories or subsets such goods.
When ensuring that the population within each sub-region is above a threshold, the geographic sub-region determination system can determine the number and boundaries of each sub-region such that each sub-region has a people defined by a threshold corresponding to a number (y) of goods (e.g., homes, vehicles, businesses, electronic devices, etc.) in each sub-region.
The population as described here can correspond to a determined number of images obtained for sites within a particular geographic area and many detections of goods, entities, or the like within such images. In this example, when ensuring that the population within each sub-region is above a threshold, the geographic sub-region determination system can determine the number and boundaries of each sub-region such that each sub-region has a people defined by a threshold corresponding to a number (z) of images and detected objects within the photos in each sub-region.
By partitioning a geographic area into sub-regions, the size of sub-regions is dynamically determined based on population density (or corresponding density of brand detections), the likelihood of including cells corresponding to sub-regions having little to no population brand detections gets reduced.
This gets accomplished at least in part by avoiding a scenario in which many sub-regions have associated brand indices but where each sub-region has such a small number of inhabitants that the data from those sub-regions are not statistically relevant.
Similarly, the size of cells within sub-regions with a more significant number of brand detections can become determined to help ensure an appropriate size to maintain distinctions within a distribution level of brand detections.
This can help ensure that meaningful brand penetration measures can get determined for a geographic area. As such, cell size can vary based on different regions. For example, cell size can get smaller in urban locations and progressively larger when transitioning from urban areas into suburban areas and rural areas.
An image content analysis engine can become configured to determine from images captured at sites within each sub-regions and many detections of a brand within each respective sub-region. The images captured at sites can include a substantially extensive collection of photos. The collection of images can have gotten captured at locations within each sub-region by a camera operating at street level.
For example, the camera operating at street level can become mounted on a vehicle and configured to collect images while the car is traversing street locations within a geographic region.
The collection of images can include, for example, many different photographic images and sequence(s) of images from a video. Such photos get geotagged with geographic identifiers descriptive of a geographic location associated with the camera when it captured each image.
The image content analysis engine can store, include or access machine-learned image content analysis models. For example, the image content analysis models can otherwise include various machine-learned models such as neural networks (e.g., feed-forward, recurrent, and convolutional, neural, etc.) or other multi-layer non-linear models regression-based models, or the like.
The Machine-Learned Image Content Analysis Model(s) Can Detect Text and Logos Associated With A Brand
The machine-learned image content analysis model(s) can:
-
-
- Detect text and logos associated with a brand within each image of a collection of images related to the geographic area
- Install a text transcription identification and a logo matching title. For example, text transcription and symbols can get compared to text and logo options identified in a predetermined dataset of text transcription and logo options (e.g., names of text and symbols associated with a particular type of label (e.g., terms of vehicle makes))
- The brand can get associated with a particular category of goods (e.g., vehicles, business entity types, vendor payment types, apparel, shoes, etc.). More particularly, in some examples, the image content analysis engine can get configured to determine each brand detection from the images captured at the one site from an entity storefront appearing within the images.
-
Brand Detection In Entity Storefront Examples
This section reminded me of storefront Images from Streetview Cameras.
The patent tells us that Brand detection in entity storefront examples can include but are not limited to a brand name associated with the entity itself. It then provides examples such as:
-
-
- Types of fast food stores
- Convenience stores
- Gas stations
- Grocery stores
- Pharmacies
- Other types of business entities.
-
It can also look for vendor payment types associated with the entity (e.g., detecting names and logos indicating that the entity will accept payment from respective credit card companies or the like).
Other Sources of Brand Detection
Vehicles – the image content analysis engine can determine the brand from the images captured at the sites from a car in the pictures.
BillBoards – the image content analysis engine can determine the brand from the images captured at sites from billboard(s) in the pictures.
Appreciate that the subject systems and methods applied to many other examples of images and brands while remaining within the spirit and scope of the disclosed technology.
Referring to example aspects of an image content analysis engine, the machine-learned image content analysis model can get configured to receive each image in the collection of images as input to the machine-learned image content analysis model. The machine-learned image content analysis model can get configured to generate output data associated with detections of brands appearing within the images in response to the collection of pictures. For example, the machine-learned content analysis model can get configured to generate a bounding box associated with each detected brand. Output data can also include labels associated with each detected brand. Each title provides a semantic tag associated with some aspect of the brand. These can be the brand name and goods associated with a brand.
A vehicle within an image, labels associated with the vehicle could include a vehicle model label (e.g., Camry), a car make the label (e.g., Toyota), a vehicle class label (e.g., sedan), a vehicle color label (e.g., white), or other identifiers.
The output data can also include a confidence score descriptive of a probability that the detected brand is correctly detected within that bounding box. Such output data can become aggregated over the collection of images to determine a count descriptive of the number of detections of the brand within the geographic region or within specific sub-regions.
Detections of Brands in Different Sub-Regions
Advertisements appear in many places, and products often have logos identifying them. This patent tells us that it is actively looking for those.
A brand penetration index generation system can become configured to generate a brand penetration index for each sub-region. The brand penetration index gets based on the number of detections of the brand in the respective sub-region. A count descriptive of the number of detections of the brand can be weighted by factors including but not limited to: a population factor based on a population within the sub-region; a category factor based on a category of goods associated with the brand; a source factor based on several source locations for a brand within a sub-region, such as dealerships or stores, etc.
Brand Capacity and Brand Saturation
Brand capacity is the total number of all brands detected in an area or an unlimited number of possible detections based on population within an area).
Brand saturation is an amount or index of detections of similar brands in the area).
This brand penetration index can become determined as representing brand prominence in a particular category. This means, for example, the number of detections of the vehicle make/model in a category such as sedans, luxury cars, all cars.
Refining Detections in the Brand Penetration Index
The brand penetration index generation system can become configured to refine detections by de-duplicating multiple detections associated with a distinct geographic location.
That refining process can help increase accuracy and usefulness within the disclosed techniques while making the disclosed systems and methods more immune to potential disparities and differences associated with a large imagery corpus for determining brand detections.
For example, refining can help reduce potential bias in some portions of a geographic area being more prominent than others.
Potential Disparities of Brand Detections
Potential disparities of brand detections can arise because of:
-
-
- Differences in the total number of images available at different locations. Such as images affected by the speed of the operator, vehicle or human, that took the photos
- Inconsistencies in the times, circumstances, and weather patterns existing when images become taken
- The visibility viewshed of each brand object
-
The patent tells us that these problems can become consistently solved by:
-
-
- Refining brand detection data using knowledge of the operator/vehicle routes
- When the images got taken
- Geolocation and pose information from each image
- The detection box within an image for each detection
-
Then, it becomes possible to de-duplicate the obtained detections. Each detection box can become associated with a well-defined real-world location, and the number of distinct locations associated with detections within a sub-region can get counted.
Problems with Some Brand Occurrences
Another possible concern about some brand occurrences, especially for vehicles, is that they may not necessarily get associated with the people living in a given geographic area.
This is not expected to become a significant source of error as most travel is local and should dominate the corpus of obtained imagery detections.
But, in some scenarios, it may become desirable to include all detections, whether based on people/homes/vehicles/etc. that are local to the area or simply traveling through it.
Storing The Brand Penetration Index And Tracking Changes Over Time
According to another aspect of the present disclosure, the computer can become configured to store the brand penetration index generated for each sub-region in a regional brand penetration database. The regional brand penetration database can correspond, for example, to a memory including tangible, non-transitory, computer-readable media, or other suitable computer program product(s). The brand penetration index for each sub-region can get stored in the regional brand penetration database associated with an indicator of the respective sub-region. The brand penetration indices for a plurality of sub-regions can become ordered within the brand penetration database. The sub-regions or corresponding indices get stored in a manner indicating the most dominated to least dominated sub-regions (or vice versa) to measures of brand penetration.
The brand penetration index generation system can track how index values stored within the regional brand penetration system database change over time. For example, the brand penetration index generation system can get configured to determine a shift factor indicative of dynamic shifts in each sub-regions brand penetration index over time periods.
The system can get configured to generate flags, notifications, and automated system adjustments when a determined shift factor exceeds predetermined threshold levels. These shift factors and associated notifications can become used to help identify successful brand penetration or areas in which more targeted brand penetration gets desired.
A Targeted Advertisement System Coupled With the Regional Brand Penetration Database
The computer can also include a targeted advertisement system coupled with the regional brand penetration database and an electronic content database.
This targeted advertisement system can become configured to determine an electronic content item from the electronic content database.
This electronic content item can get associated with the brand based at least in part on the brand penetration index for a given sub-region of the two or more sub-regions.
The electronic content item can become configured for delivery to and display on an electric device associated with the given sub-region. For example, an electronic device associated with a sub-region could correspond to an electronic device operating with an IP address or other identifier associated with a physical address located within the sub-region.
In other examples, an electronic device associated with a sub-region could correspond to an electronic device owned by a user living in the sub-region or currently operating in the sub-region. This may become the case with mobile computers or the like.
Serving Brand Content To Users In A Physical Manner
The computer can also include reversing geocoding features that can help determine physical addresses for serving brand content to users in a physical manner instead of an electronic manner.
The brand penetration determination system and targeted advertisement system can more particularly include a reverse geocoding system configured to map cells corresponding to sub-regions within a geographic area to physical addresses within those cells/sub-regions.
The reverse geocoding system can leverage databases and systems that map various geographic coordinates (e.g., latitude and longitude values) associated with cells/sub-regions to physical addresses within or otherwise associated with those areas.
These physical addresses can be stored in memory (e.g., in the regional brand penetration database) and other respective cells/sub-regions indicators and corresponding brand penetration indices.
Measures of brand penetration determined for particular cells/sub-regions can then get used to determine content items. Such as targeted advertisement mailings. These can work for selected delivery to physical addresses within those cells/sub-regions.
By utilizing the disclosed brand penetration index in dynamically determining or adjusting electronic content delivered to users, advertisers can more accurately target products to the most suitable audience.
More particularly, electronic content can become strategically determined for delivery to users within geographic areas having a below-average penetration of a particular brand and above-average penetration of competing brands.
The further analytics implemented by a targeted advertisement system can determine penetration measures of variables, including various threshold levels of brand penetration.
Brand Penetration Tracking
The systems and methods described here may provide many technical effects and benefits. For instance, a computer can include a brand penetration determination system that generates meaningful object detection data associated with a large corpus of collected imagery. More particularly, the detection of brands associated with goods, services, and the like within images can become correlated to statistically relevant measures of brand indices representative of brand capacity, prominence, brand saturation, etc., in a computationally workable manner.
Besides, these measures of brand penetration can become advantageously tracked and aggregated over space. Such as various geographic regions. It can also be tracked over time. These can be various windows–times of day, days of the week, months of the year, etc. They can determine alternative data measures.
A further technical benefit of the disclosed technology concerns integrating a geographic sub-region determination system, which can get configured to determine sub-regions numbers and boundaries within a geographic area to ensure that a population within each sub-region is above a threshold. By ensuring that the population of each sub-region is above that threshold, a computational burden gets imposed in storing statistically relevant brand indices for each sub-region gets reduced.
In addition, by ensuring that only brand indices for sub-regions having a statistically meaningful number of inhabitants get stored. The disclosed systems and methods can provide useful data associated with an imagery corpus while simultaneously minimizing the costs of storing that data in memory as the disclosed technology can achieve such, specific improvements in computing technology.
Integration Within A Targeted Advertisement System
A further technical effect and benefit of the disclosed technology can get realized when the disclosed technology becomes integrated within the application of a targeted advertisement system. Advertisers are commonly faced with determining how to accurately target product(s) and services to the most suitable audience.
This problem can involve many variables, where various demographics, cultural differences, infrastructure, and other considerations come into play. Such technology is used by providing systems and methods for generating computationally efficient and meaningful measures of geographic partitioning and corresponding brand penetration. In combination with other demographic indicators, this can be possible to dynamically develop advertising strategies for targeted delivery of electronic content to consumers.
With reference now to the Figures, example embodiments of the present disclosure will become discussed in further detail.
Brand Penetration Conclusion
The patent provides more details about this tracking of Brands in different geographic areas. It potentially can mean a lot of counting a tracking in the physical world. A log of this can be done through image analysis using programs such as streetview. It’s interesting knowing that Google might have a good idea of where all of the brands might be in the future and know things such as brand capacity and brand saturation in different geographic areas. Will Google know brands this well at some point in the future?
In 2020, I wrote about how Google might track product lines more closely on the Web in the post: Google Product Search and Learning about New Product Lines. There was a point in the past where Google did not seem to pay much attention to brands. With that earlier patent on product lines and this one on brand penetration, that has the potential to change in a big way really fast.
Google is showing us that they are using technologies such as image recognition and streetview cameras to learn more about the world around us. This is also seen in a recent post:
An Image Content Analysis And A Geo-Semantic Index For Recommendations
Search News Straight To Your Inbox
*Required
About Bill Slawski
With more than 26 years of SEO experience and a Juris Doctor Degree, Bill Slawski is the foremost expert on Google’s patents as related to SEO. Patent Exploration is one of the quickest and most detailed ways to find new information about SEO. Bill is the Editor of SEO by the Sea, a prominent search engine optimization blog, where he is the author of over 1,300 posts. Bill’s experience includes Fortune 500 brands and some of the largest websites in the world. Bill is a contributing author for Moz, Search Engine Land, and Search Engine Journal. In 2014-2021, he spoke at industry-leading international conferences about topics including search engine algorithms, universal and blended search, personalization in search, search and social, and duplicate content problems, structured data, and schemaJoin thousands of marketers to get the best search news in under 5 minutes. Get resources, tips and more with The Splash newsletter: